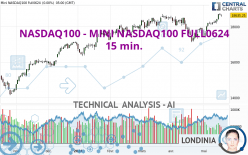
NASDAQ100 - MINI NASDAQ100 FULL0624 - 15 min. - Technical analysis published on 05/20/2024 (GMT)
- 78
- 0
Click here for a new analysis!
- Timeframe : 15 min.
- - Analysis generated on
- Status : INVALID

Summary of the analysis

Additional analysis
Quotes
NASDAQ100 - MINI NASDAQ100 FULL0624 rating 18,652.75 USD. The price registered an increase of +0.09% on the session and was between 18,633.00 USD and 18,689.50 USD. This implies that the price is at +0.11% from its lowest and at -0.20% from its highest.The Central Gaps scanner detects a bearish opening marking the presence of sellers ahead of buyers at the opening but not sufficiently marked to allow the price to register a quotation gap.
Bearish opening
Type : Bearish
Timeframe : Openning
A study of price movements over other periods shows the following variations:
Near a new HIGH record (5 years)
Type : Bullish
Timeframe : Weekly
Near a new HIGH record (1 year)
Type : Bullish
Timeframe : Weekly
Near a new HIGH record (1st january)
Type : Bullish
Timeframe : Weekly
Near a new HIGH record (1 month)
Type : Bullish
Timeframe : Weekly
Technical
Technical analysis of this 15 min. chart of NASDAQ100 - MINI NASDAQ100 FULL0624 indicates that the overall trend is bearish. 75.00% of the signals given by moving averages are bearish. The overall trend is reinforced by the strong bearish signals from short-term moving averages. The Central Indicators market scanner is currently detecting several bearish signals that could impact this trend:
Bearish trend reversal : Moving Average 20
Type : Bearish
Timeframe : 15 minutes
Bearish trend reversal : Moving Average 50
Type : Bearish
Timeframe : 15 minutes
Bearish trend reversal : Moving Average 100
Type : Bearish
Timeframe : 15 minutes
Bearish trend reversal : adaptative moving average 50
Type : Bearish
Timeframe : 15 minutes
Bearish trend reversal : adaptative moving average 100
Type : Bearish
Timeframe : 15 minutes
Bearish price crossover with adaptative moving average 100
Type : Bearish
Timeframe : 15 minutes
Technical indicators are bearish. There is still some doubt about the decline in the price.
Caution: the Central Indicators scanner currently detects an excess:
CCI indicator is oversold : under -100
Type : Neutral
Timeframe : 15 minutes
Previous candle closed under Bollinger bands
Type : Neutral
Timeframe : 15 minutes
CCI indicator: bullish divergence
Type : Bullish
Timeframe : 15 minutes
Williams %R indicator is oversold : under -80
Type : Neutral
Timeframe : 15 minutes
No signals are given by Central Patterns, a market scanner specialised in chart patterns, resistances and supports.
The Central Candlesticks scanner, specialised in Japanese candlesticks, did not identify any signals.
| S3 | S2 | S1 | Price | R1 | R2 | |
|---|---|---|---|---|---|---|
| ProTrendLines | 18,165.25 | 18,348.00 | 18,585.75 | 18,652.75 | 18,686.75 | 18,760.75 |
| Change (%) | -2.61% | -1.63% | -0.36% | - | +0.18% | +0.58% |
| Change | -487.50 | -304.75 | -67.00 | - | +34.00 | +108.00 |
| Level | Intermediate | Minor | Major | - | Minor | Intermediate |
To determine price objectives, it is also possible to use the pivot points. Here is the price position in relation to pivot points:
| Pivot points | S3 | S2 | S1 | PP | R1 | R2 | R3 |
|---|---|---|---|---|---|---|---|
| Standard | 18,416.17 | 18,480.58 | 18,557.92 | 18,622.33 | 18,699.67 | 18,764.08 | 18,841.42 |
| Camarilla | 18,596.27 | 18,609.26 | 18,622.26 | 18,635.25 | 18,648.24 | 18,661.24 | 18,674.23 |
| Woodie | 18,422.63 | 18,483.81 | 18,564.38 | 18,625.56 | 18,706.13 | 18,767.31 | 18,847.88 |
| Fibonacci | 18,480.58 | 18,534.73 | 18,568.19 | 18,622.33 | 18,676.48 | 18,709.94 | 18,764.08 |
| Pivot points | S3 | S2 | S1 | PP | R1 | R2 | R3 |
|---|---|---|---|---|---|---|---|
| Standard | 17,685.00 | 17,925.25 | 18,280.25 | 18,520.50 | 18,875.50 | 19,115.75 | 19,470.75 |
| Camarilla | 18,471.56 | 18,526.12 | 18,580.69 | 18,635.25 | 18,689.82 | 18,744.38 | 18,798.94 |
| Woodie | 17,742.38 | 17,953.94 | 18,337.63 | 18,549.19 | 18,932.88 | 19,144.44 | 19,528.13 |
| Fibonacci | 17,925.25 | 18,152.64 | 18,293.12 | 18,520.50 | 18,747.89 | 18,888.37 | 19,115.75 |
| Pivot points | S3 | S2 | S1 | PP | R1 | R2 | R3 |
|---|---|---|---|---|---|---|---|
| Standard | 15,390.25 | 16,251.75 | 16,845.00 | 17,706.50 | 18,299.75 | 19,161.25 | 19,754.50 |
| Camarilla | 17,038.19 | 17,171.55 | 17,304.90 | 17,438.25 | 17,571.60 | 17,704.95 | 17,838.31 |
| Woodie | 15,256.13 | 16,184.69 | 16,710.88 | 17,639.44 | 18,165.63 | 19,094.19 | 19,620.38 |
| Fibonacci | 16,251.75 | 16,807.47 | 17,150.79 | 17,706.50 | 18,262.22 | 18,605.54 | 19,161.25 |
Numerical data
The following is the status of the technical indicators and moving averages at the time of publication of this technical analysis:
| RSI (14): | 41.52 | |
| MACD (12,26,9): | -0.2500 | |
| Directional Movement: | -17.88 | |
| AROON (14): | -35.71 | |
| DEMA (21): | 18,667.85 | |
| Parabolic SAR (0,02-0,02-0,2): | 18,687.50 | |
| Elder Ray (13): | -15.73 | |
| Super Trend (3,10): | 18,683.76 | |
| Zig ZAG (10): | 18,649.75 | |
| VORTEX (21): | 0.9400 | |
| Stochastique (14,3,5): | 24.99 | |
| TEMA (21): | 18,665.01 | |
| Williams %R (14): | -89.73 | |
| Chande Momentum Oscillator (20): | -22.00 | |
| Repulse (5,40,3): | -0.0900 | |
| ROCnROLL: | 2 | |
| TRIX (15,9): | 0.0000 | |
| Courbe Coppock: | 0.01 |
| MA7: | 18,513.11 | |
| MA20: | 18,082.26 | |
| MA50: | 18,152.88 | |
| MA100: | 17,967.60 | |
| MAexp7: | 18,660.57 | |
| MAexp20: | 18,669.23 | |
| MAexp50: | 18,666.02 | |
| MAexp100: | 18,663.69 | |
| Price / MA7: | +0.75% | |
| Price / MA20: | +3.15% | |
| Price / MA50: | +2.75% | |
| Price / MA100: | +3.81% | |
| Price / MAexp7: | -0.04% | |
| Price / MAexp20: | -0.09% | |
| Price / MAexp50: | -0.07% | |
| Price / MAexp100: | -0.06% |
About author

Online


Add a comment
Comments
0 comments on the analysis NASDAQ100 - MINI NASDAQ100 FULL0624 - 15 min.