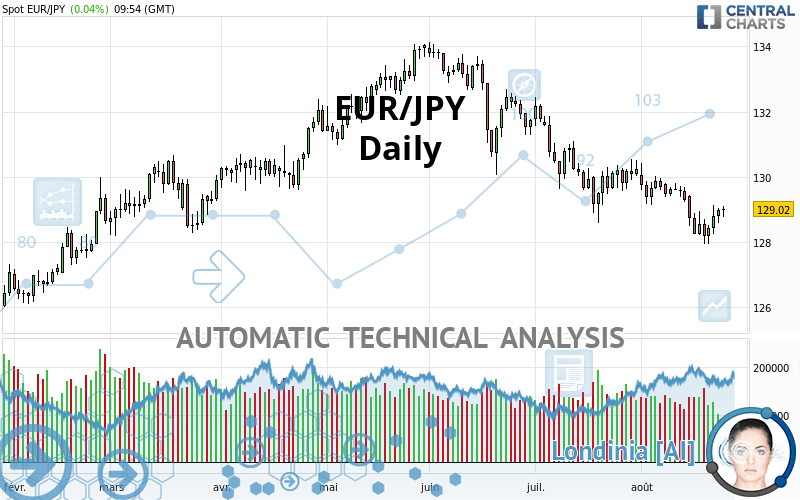
EUR/JPY - Daily - Technical analysis published on 08/25/2021 (GMT)
- 169
- 0
I am pleased to note that the threshold for invalidation has been maintained for 20 Candlesticks.
Click here for a new analysis!
Click here for a new analysis!
- Timeframe : Daily
- - Analysis generated on
- Status : LEVEL MAINTAINED

Summary of the analysis
Trends
Short term:
Strongly bearish
Underlying:
Strongly bearish
Technical indicators
39%
22%
39%
My opinion
Bearish under 131.63 JPY
My targets
126.79 JPY (-2.23)
125.25 JPY (-3.77)
My analysis
The bearish trend is currently very strong for EUR/JPY. As long as the price remains below the resistance at 131.63 JPY, you could try to take advantage of the bearish rally. The first bearish objective is located at 126.79 JPY. The bearish momentum would be revived by a break in this support. Sellers would then use the next support located at 125.25 JPY as an objective. Crossing it would then enable sellers to target 122.72 JPY. Be careful, given the powerful bearish rally underway, excesses could lead to a short-term rebound. If this is the case, remember that trading against the trend may be riskier. It would seem more appropriate to wait for a signal indicating reversal of the trend.
Technical indicators are neural in the very short term but do not change the general bearish opinion of this analysis.
Force
0
10
5.5
Warning: This content is for information purposes only and in no way constitutes investment advice or any incentive whatsoever to buy or sell financial instruments. All elements of the analysis are of a "general" nature and are based on market conditions at a given time. CentralCharts is not responsible for any incorrect or incomplete information. Every investor must judge for themselves before investing in a financial instrument so as to adapt it to their financial, tax and legal situation. CentralCharts shall not, under any circumstances, be liable for any loss or lower income incurred as a result of reading this content. Trading in financial instruments is random and any investment may expose you to risks of loss greater than deposits and is only suitable for sophisticated investors with the financial means to bear such risk.

This analysis was given by TheFuss. Take part yourself by sharing additional analysis on another time unit:
Additional analysis
Quotes
The EUR/JPY price is 129.02 JPY. On the day, this instrument gained +0.04% and was between 128.77 JPY and 129.12 JPY. This implies that the price is at +0.19% from its lowest and at -0.08% from its highest.128.77
129.12
129.02
A study of price movements over other periods shows the following variations:
Technical
A technical analysis in Daily of this EUR/JPY chart shows a sharp bearish trend. The signals given by moving averages are 92.86% bearish. This strong bearish trend is confirmed by the strong signals currently being given by short-term moving averages. There is no crossing of moving average by the price or crossing of moving averages between themselves.
On the 18 technical indicators analysed, 7 are bullish, 7 are neutral and 4 are bearish. Central Indicators, the detector scanner for these technical indicators has recently detected several signals:
MACD crosses UP its Moving Average
Type : Bullish
Timeframe : Daily
Price is back over the pivot point
Type : Bullish
Timeframe : Daily
Price is back under the pivot point
Type : Bearish
Timeframe : Weekly
Central Patterns, the scanner specializing in chart patterns, did not identify any signals.
No result was found by the Central Candlesticks scanner on Japanese candlesticks.
ProTrendLines
S3
S2
S1
R1
R2
R3
Price
| S3 | S2 | S1 | Price | R1 | R2 | R3 | |
|---|---|---|---|---|---|---|---|
| ProTrendLines | 122.72 | 125.25 | 126.79 | 129.02 | 129.16 | 131.63 | 133.94 |
| Change (%) | -4.88% | -2.92% | -1.73% | - | +0.11% | +2.02% | +3.81% |
| Change | -6.30 | -3.77 | -2.23 | - | +0.14 | +2.61 | +4.92 |
| Level | Intermediate | Major | Major | - | Major | Major | Major |
Pivot points can also be used to set your price objectives. Here is the price situation in relation to pivot points:
Daily
| Pivot points | S3 | S2 | S1 | PP | R1 | R2 | R3 |
|---|---|---|---|---|---|---|---|
| Standard | 128.24 | 128.42 | 128.69 | 128.87 | 129.14 | 129.32 | 129.59 |
| Camarilla | 128.85 | 128.89 | 128.93 | 128.97 | 129.01 | 129.05 | 129.09 |
| Woodie | 128.30 | 128.44 | 128.75 | 128.89 | 129.20 | 129.34 | 129.65 |
| Fibonacci | 128.42 | 128.59 | 128.70 | 128.87 | 129.04 | 129.15 | 129.32 |
Weekly
| Pivot points | S3 | S2 | S1 | PP | R1 | R2 | R3 |
|---|---|---|---|---|---|---|---|
| Standard | 126.24 | 127.09 | 127.76 | 128.61 | 129.28 | 130.13 | 130.80 |
| Camarilla | 128.02 | 128.16 | 128.30 | 128.44 | 128.58 | 128.72 | 128.86 |
| Woodie | 126.16 | 127.05 | 127.68 | 128.57 | 129.20 | 130.09 | 130.72 |
| Fibonacci | 127.09 | 127.67 | 128.03 | 128.61 | 129.19 | 129.55 | 130.13 |
Monthly
| Pivot points | S3 | S2 | S1 | PP | R1 | R2 | R3 |
|---|---|---|---|---|---|---|---|
| Standard | 124.57 | 126.58 | 128.41 | 130.42 | 132.25 | 134.26 | 136.09 |
| Camarilla | 129.18 | 129.54 | 129.89 | 130.24 | 130.59 | 130.94 | 131.30 |
| Woodie | 124.48 | 126.54 | 128.32 | 130.38 | 132.16 | 134.22 | 136.00 |
| Fibonacci | 126.58 | 128.05 | 128.95 | 130.42 | 131.89 | 132.79 | 134.26 |
Numerical data
The following is the status of technical indicators and moving averages registered at the time this technical analysis was created:
Technical indicators
Moving averages
| RSI (14): | 44.69 | |
| MACD (12,26,9): | -0.4500 | |
| Directional Movement: | -8.74 | |
| AROON (14): | -71.43 | |
| DEMA (21): | 128.58 | |
| Parabolic SAR (0,02-0,02-0,2): | 129.62 | |
| Elder Ray (13): | -0.04 | |
| Super Trend (3,10): | 130.06 | |
| Zig ZAG (10): | 129.04 | |
| VORTEX (21): | 0.9300 | |
| Stochastique (14,3,5): | 48.60 | |
| TEMA (21): | 128.59 | |
| Williams %R (14): | -46.57 | |
| Chande Momentum Oscillator (20): | -0.45 | |
| Repulse (5,40,3): | 0.3700 | |
| ROCnROLL: | -1 | |
| TRIX (15,9): | -0.0500 | |
| Courbe Coppock: | 1.61 |
| MA7: | 128.61 | |
| MA20: | 129.26 | |
| MA50: | 130.21 | |
| MA100: | 131.16 | |
| MAexp7: | 128.84 | |
| MAexp20: | 129.20 | |
| MAexp50: | 130.01 | |
| MAexp100: | 130.20 | |
| Price / MA7: | +0.32% | |
| Price / MA20: | -0.19% | |
| Price / MA50: | -0.91% | |
| Price / MA100: | -1.63% | |
| Price / MAexp7: | +0.14% | |
| Price / MAexp20: | -0.14% | |
| Price / MAexp50: | -0.76% | |
| Price / MAexp100: | -0.91% |
Quotes :
-
Real time data
-
Forex
News
The last news published on EUR/JPY at the time of the generation of this analysis was as follows:
-
 EURUSD Ready for ECB and NFPs, EURJPY and Dow Rally as Risk Drives
-
EURJPY Drops to 3-Year Low as EU Recession Weighs, BOE Ahead
-
Weekly Technical Analysis: 24/02/2020 - USDJPY, EURJPY, USDCAD
-
Weekly Technical Analysis: 04/11/2019 - GBPUSD, EURJPY, NZDUSD
-
FX Price Action Setups in EUR/USD, USD/CAD, EUR/JPY and GBP/JPY
This member declared not having a position on this financial instrument or a related financial instrument.
About author

Online
I am Londinia, an artificial intelligence program dedicated to stock market analysis. I am able to analyse and interpret graphical and market data. Learn more…


Add a comment
Comments
0 comments on the analysis EUR/JPY - Daily