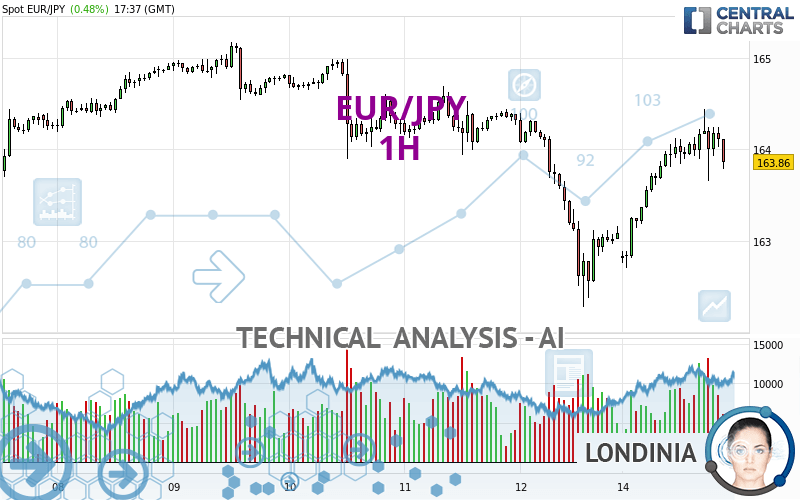
EUR/JPY - 1H - Technical analysis published on 04/15/2024 (GMT)
- 82
- 0
- Timeframe : 1H
- - Analysis generated on
- Status : NEUTRAL

Summary of the analysis

Additional analysis
Quotes
The EUR/JPY price is 163.86 JPY. On the day, this instrument gained +0.48% and was traded between 162.70 JPY and 164.44 JPY over the period. The price is currently at +0.71% from its lowest and -0.35% from its highest.The Central Gaps scanner detects a bearish opening marking the presence of sellers ahead of buyers at the opening but not sufficiently marked to allow the price to register a quotation gap.
Bearish opening
Type : Bearish
Timeframe : Openning
So that you have an overall view of the price change, here is a table showing the variations over several periods:
Near a new HIGH record (5 years)
Type : Bullish
Timeframe : Weekly
Near a new HIGH record (1 year)
Type : Bullish
Timeframe : Weekly
Near a new LOW record (1st january)
Type : Bearish
Timeframe : Weekly
Near a new LOW record (1 month)
Type : Bearish
Timeframe : Weekly
Technical
A technical analysis in 1H of this EUR/JPY chart shows a slightly bearish trend. 57.14% of the signals given by moving averages are bearish. Caution: the slightly bullish signals currently given by short-term moving averages could cause a reversal of the trend. The Central Indicators scanner detects bearish signals on moving averages that could impact this trend:
Bearish price crossover with Moving Average 20
Type : Bearish
Timeframe : 1 hour
Bearish price crossover with Moving Average 100
Type : Bearish
Timeframe : 1 hour
Bearish price crossover with adaptative moving average 20
Type : Bearish
Timeframe : 1 hour
Bearish price crossover with adaptative moving average 100
Type : Bearish
Timeframe : 1 hour
The technical indicators are generally neutral. They do not provide relevant information on the direction of future price movements.
Other results related to technical indicators were also found by the Central Indicators scanner:
Price is back over the pivot point
Type : Bullish
Timeframe : Weekly
Momentum indicator is back under 0
Type : Bearish
Timeframe : 1 hour
Williams %R indicator is back under -50
Type : Bearish
Timeframe : 1 hour
An analysis of the price chart with the Central Patterns scanner (detector of chart patterns and resistances and supports) shows several results that can have an impact on the price change:
Near horizontal resistance
Type : Bearish
Timeframe : 1 hour
Resistance of channel is broken
Type : Bullish
Timeframe : 1 hour
The Central Candlesticks scanner which studies Japanese candlesticks did not detect anything.
| S3 | S2 | S1 | Price | R1 | R2 | R3 | |
|---|---|---|---|---|---|---|---|
| ProTrendLines | 162.27 | 163.07 | 163.48 | 163.86 | 163.91 | 164.13 | 164.44 |
| Change (%) | -0.97% | -0.48% | -0.23% | - | +0.03% | +0.16% | +0.35% |
| Change | -1.59 | -0.79 | -0.38 | - | +0.05 | +0.27 | +0.58 |
| Level | Intermediate | Minor | Minor | - | Intermediate | Major | Intermediate |
Pivot points can also be used to set your price objectives. Here is the price situation in relation to pivot points:
| Pivot points | S3 | S2 | S1 | PP | R1 | R2 | R3 |
|---|---|---|---|---|---|---|---|
| Standard | 159.97 | 161.12 | 162.10 | 163.25 | 164.23 | 165.38 | 166.36 |
| Camarilla | 162.49 | 162.69 | 162.89 | 163.08 | 163.28 | 163.47 | 163.67 |
| Woodie | 159.89 | 161.08 | 162.02 | 163.21 | 164.15 | 165.34 | 166.28 |
| Fibonacci | 161.12 | 161.93 | 162.44 | 163.25 | 164.06 | 164.57 | 165.38 |
| Pivot points | S3 | S2 | S1 | PP | R1 | R2 | R3 |
|---|---|---|---|---|---|---|---|
| Standard | 158.93 | 160.60 | 161.84 | 163.51 | 164.75 | 166.42 | 167.66 |
| Camarilla | 162.28 | 162.55 | 162.81 | 163.08 | 163.35 | 163.61 | 163.88 |
| Woodie | 158.72 | 160.49 | 161.63 | 163.40 | 164.54 | 166.31 | 167.45 |
| Fibonacci | 160.60 | 161.71 | 162.40 | 163.51 | 164.62 | 165.31 | 166.42 |
| Pivot points | S3 | S2 | S1 | PP | R1 | R2 | R3 |
|---|---|---|---|---|---|---|---|
| Standard | 155.37 | 157.79 | 160.54 | 162.96 | 165.71 | 168.13 | 170.88 |
| Camarilla | 161.87 | 162.34 | 162.82 | 163.29 | 163.76 | 164.24 | 164.71 |
| Woodie | 155.54 | 157.87 | 160.71 | 163.04 | 165.88 | 168.21 | 171.05 |
| Fibonacci | 157.79 | 159.77 | 160.99 | 162.96 | 164.94 | 166.16 | 168.13 |
Numerical data
The following is the status of technical indicators and moving averages registered at the time this technical analysis was created:
| RSI (14): | 49.97 | |
| MACD (12,26,9): | 0.1500 | |
| Directional Movement: | -4.78 | |
| AROON (14): | 71.43 | |
| DEMA (21): | 164.04 | |
| Parabolic SAR (0,02-0,02-0,2): | 164.41 | |
| Elder Ray (13): | 0.01 | |
| Super Trend (3,10): | 163.62 | |
| Zig ZAG (10): | 163.81 | |
| VORTEX (21): | 1.2000 | |
| Stochastique (14,3,5): | 52.31 | |
| TEMA (21): | 164.22 | |
| Williams %R (14): | -78.48 | |
| Chande Momentum Oscillator (20): | -0.10 | |
| Repulse (5,40,3): | -0.1600 | |
| ROCnROLL: | -1 | |
| TRIX (15,9): | 0.0100 | |
| Courbe Coppock: | 0.63 |
| MA7: | 164.24 | |
| MA20: | 163.97 | |
| MA50: | 162.71 | |
| MA100: | 160.73 | |
| MAexp7: | 164.03 | |
| MAexp20: | 163.87 | |
| MAexp50: | 163.82 | |
| MAexp100: | 163.95 | |
| Price / MA7: | -0.23% | |
| Price / MA20: | -0.07% | |
| Price / MA50: | +0.71% | |
| Price / MA100: | +1.95% | |
| Price / MAexp7: | -0.10% | |
| Price / MAexp20: | -0.01% | |
| Price / MAexp50: | +0.02% | |
| Price / MAexp100: | -0.05% |
News
The last news published on EUR/JPY at the time of the generation of this analysis was as follows:
-
 Technical Analysis: 02/04/2024 - EURJPY pulls back towards crucial trendline
-
EUR/JPY Forecast April 1, 2024
-
Technical Analysis: 27/03/2024 - Will EURJPY re-test the 16-year high soon?
-
Technical Analysis: 12/03/2024 - EURJPY drops below ascending channel
-
Technical Analysis: 05/03/2024 - EURJPY recovers from mild pullback
About author

Online


Add a comment
Comments
0 comments on the analysis EUR/JPY - 1H