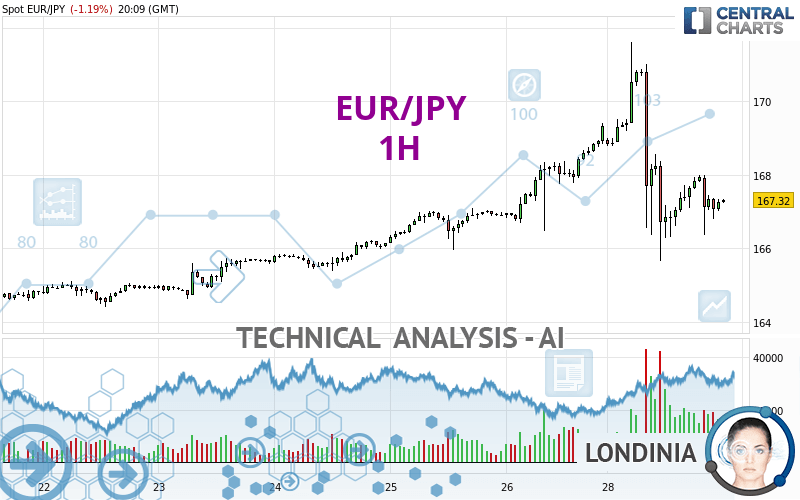
EUR/JPY - 1H - Technical analysis published on 04/29/2024 (GMT)
- 77
- 0
Click here for a new analysis!
- Timeframe : 1H
- - Analysis generated on
- Status : INVALID

Summary of the analysis

Additional analysis
Quotes
The EUR/JPY rating is 167.33 JPY. The price is lower by -1.18% since the last closing with the lowest point at 165.65 JPY and the highest point at 171.62 JPY. The deviation from the price is +1.01% for the low point and -2.50% for the high point.The Central Gaps scanner detects a bearish opening. A small advantage for sellers in the very short term.
Bearish opening
Type : Bearish
Timeframe : Openning
Here is a more detailed summary of the historical variations registered by EUR/JPY:
New HIGH record (5 years)
Type : Bullish
Timeframe : Weekly
New HIGH record (1 year)
Type : Bullish
Timeframe : Weekly
New HIGH record (1st january)
Type : Bullish
Timeframe : Weekly
New HIGH record (1 month)
Type : Bullish
Timeframe : Weekly
Technical
A technical analysis in 1H of this EUR/JPY chart shows a neutral trend. The strong bearish signals currently being given by short-term moving averages could allow the overall trend to return to a bearish trend. An assessment of moving averages reveals a bearish signal that could impact this trend:
Moving Average bearish crossovers : MA20 & MA50
Type : Bearish
Timeframe : 1 hour
An assessment of technical indicators does not currently provide any relevant information on the direction of future price movements.
Central Indicators, the detector scanner for these technical indicators has recently detected several signals:
Pivot points : price is under support 1
Type : Neutral
Timeframe : 1 hour
Price is back under the pivot point
Type : Bearish
Timeframe : Weekly
Momentum indicator is back over 0
Type : Bullish
Timeframe : 1 hour
Williams %R indicator is back over -50
Type : Bullish
Timeframe : 1 hour
Central Patterns, the market scanner focusing on chart patterns, resistances and supports found these results:
Near horizontal support
Type : Bullish
Timeframe : 1 hour
Support of channel is broken
Type : Bearish
Timeframe : 1 hour
The Central Candlesticks scanner which studies Japanese candlesticks did not detect anything.
| S3 | S2 | S1 | Price | R1 | |
|---|---|---|---|---|---|
| ProTrendLines | 164.13 | 165.07 | 167.08 | 167.33 | 169.54 |
| Change (%) | -1.91% | -1.35% | -0.15% | - | +1.32% |
| Change | -3.20 | -2.26 | -0.25 | - | +2.21 |
| Level | Major | Intermediate | Minor | - | Intermediate |
To determine price objectives, it is also possible to use the pivot points. Here is the price position in relation to pivot points:
| Pivot points | S3 | S2 | S1 | PP | R1 | R2 | R3 |
|---|---|---|---|---|---|---|---|
| Standard | 164.47 | 165.47 | 167.40 | 168.40 | 170.33 | 171.33 | 173.26 |
| Camarilla | 168.52 | 168.79 | 169.06 | 169.33 | 169.60 | 169.87 | 170.14 |
| Woodie | 164.94 | 165.70 | 167.87 | 168.63 | 170.80 | 171.56 | 173.73 |
| Fibonacci | 165.47 | 166.59 | 167.28 | 168.40 | 169.52 | 170.21 | 171.33 |
| Pivot points | S3 | S2 | S1 | PP | R1 | R2 | R3 |
|---|---|---|---|---|---|---|---|
| Standard | 161.02 | 162.71 | 166.02 | 167.71 | 171.02 | 172.71 | 176.02 |
| Camarilla | 167.96 | 168.41 | 168.87 | 169.33 | 169.79 | 170.25 | 170.71 |
| Woodie | 161.83 | 163.12 | 166.83 | 168.12 | 171.83 | 173.12 | 176.83 |
| Fibonacci | 162.71 | 164.62 | 165.80 | 167.71 | 169.62 | 170.80 | 172.71 |
| Pivot points | S3 | S2 | S1 | PP | R1 | R2 | R3 |
|---|---|---|---|---|---|---|---|
| Standard | 155.37 | 157.79 | 160.54 | 162.96 | 165.71 | 168.13 | 170.88 |
| Camarilla | 161.87 | 162.34 | 162.82 | 163.29 | 163.76 | 164.24 | 164.71 |
| Woodie | 155.54 | 157.87 | 160.71 | 163.04 | 165.88 | 168.21 | 171.05 |
| Fibonacci | 157.79 | 159.77 | 160.99 | 162.96 | 164.94 | 166.16 | 168.13 |
Numerical data
The following are the details of the technical indicators and moving averages that were collected to generate this technical analysis:
| RSI (14): | 43.62 | |
| MACD (12,26,9): | -0.2900 | |
| Directional Movement: | -23.56 | |
| AROON (14): | -7.14 | |
| DEMA (21): | 167.36 | |
| Parabolic SAR (0,02-0,02-0,2): | 168.09 | |
| Elder Ray (13): | -0.25 | |
| Super Trend (3,10): | 169.26 | |
| Zig ZAG (10): | 167.29 | |
| VORTEX (21): | 0.9000 | |
| Stochastique (14,3,5): | 54.96 | |
| TEMA (21): | 167.00 | |
| Williams %R (14): | -39.56 | |
| Chande Momentum Oscillator (20): | 0.44 | |
| Repulse (5,40,3): | 0.0800 | |
| ROCnROLL: | 2 | |
| TRIX (15,9): | -0.0200 | |
| Courbe Coppock: | 1.36 |
| MA7: | 166.43 | |
| MA20: | 164.98 | |
| MA50: | 163.68 | |
| MA100: | 161.28 | |
| MAexp7: | 167.35 | |
| MAexp20: | 167.69 | |
| MAexp50: | 167.71 | |
| MAexp100: | 167.16 | |
| Price / MA7: | +0.54% | |
| Price / MA20: | +1.42% | |
| Price / MA50: | +2.23% | |
| Price / MA100: | +3.75% | |
| Price / MAexp7: | -0.01% | |
| Price / MAexp20: | -0.21% | |
| Price / MAexp50: | -0.23% | |
| Price / MAexp100: | +0.10% |
News
The last news published on EUR/JPY at the time of the generation of this analysis was as follows:
-
 Technical Analysis: 02/04/2024 - EURJPY pulls back towards crucial trendline
-
EUR/JPY Forecast April 1, 2024
-
Technical Analysis: 27/03/2024 - Will EURJPY re-test the 16-year high soon?
-
Technical Analysis: 12/03/2024 - EURJPY drops below ascending channel
-
Technical Analysis: 05/03/2024 - EURJPY recovers from mild pullback
About author

Online


Add a comment
Comments
0 comments on the analysis EUR/JPY - 1H