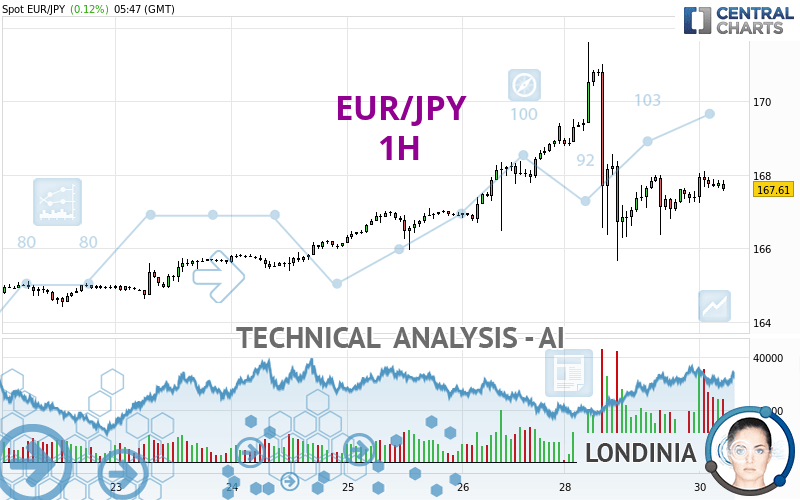
EUR/JPY - 1H - Technical analysis published on 04/30/2024 (GMT)
- 80
- 0
- Timeframe : 1H
- - Analysis generated on
- Status : NEUTRAL

Summary of the analysis
Trends
Short term:
Neutral
Underlying:
Slightly bullish
Technical indicators
44%
17%
39%
My opinion
Neutral between 167.07 JPY and 168.01 JPY
My targets
-
My analysis
The neutral short-term trend shows a weakening of the basic, slightly bullish trend on EUR/JPY. It is difficult to advise a trading direction under these conditions. The first resistance is located at 168.01 JPY. The first support is located at 167.07 JPY. We can stay away while waiting for a more pronounced price movement on this instrument. A new analysis could then be produced that would give clearer signals.
In the very short term, despite the neutral opinion of this analysis, technical indicators are bullish and could soon allow change to a bullish sentiment.
Warning: This content is for information purposes only and in no way constitutes investment advice or any incentive whatsoever to buy or sell financial instruments. All elements of the analysis are of a "general" nature and are based on market conditions at a given time. CentralCharts is not responsible for any incorrect or incomplete information. Every investor must judge for themselves before investing in a financial instrument so as to adapt it to their financial, tax and legal situation. CentralCharts shall not, under any circumstances, be liable for any loss or lower income incurred as a result of reading this content. Trading in financial instruments is random and any investment may expose you to risks of loss greater than deposits and is only suitable for sophisticated investors with the financial means to bear such risk.

This analysis was given by dtaccori. Take part yourself by sharing additional analysis on another time unit:
Additional analysis
Quotes
The EUR/JPY rating is 167.63 JPY. The price registered an increase of +0.13% on the session and was traded between 167.22 JPY and 168.10 JPY over the period. The price is currently at +0.25% from its lowest and -0.28% from its highest.167.22
168.10
167.63
So that you have an overall view of the price change, here is a table showing the variations over several periods:
New HIGH record (5 years)
Type : Bullish
Timeframe : Weekly
Near a new HIGH record (1 year)
Type : Bullish
Timeframe : Weekly
Near a new HIGH record (1st january)
Type : Bullish
Timeframe : Weekly
Near a new LOW record (1 month)
Type : Bearish
Timeframe : Weekly
Technical
A technical analysis in 1H of this EUR/JPY chart shows a slightly bullish trend. Only 57.14% of the signals given by moving averages are bullish. This slightly bullish trend could return to neutral given the neutral signals also given by short-term moving averages. There is no crossing of moving average by the price or crossing of moving averages between themselves.
In fact, only 8 technical indicators out of 18 studied are currently positioned bullish. Central Indicators, the detector scanner for these technical indicators has recently detected several signals:
RSI indicator is back under 50
Type : Bearish
Timeframe : 1 hour
Price is back under the pivot point
Type : Bearish
Timeframe : Weekly
Central Patterns, the scanner specializing in chart patterns, did not identify any signals.
The Central Candlesticks scanner which studies Japanese candlesticks did not detect anything.
ProTrendLines
S3
S2
S1
R1
R2
R3
Price
| S3 | S2 | S1 | Price | R1 | R2 | R3 | |
|---|---|---|---|---|---|---|---|
| ProTrendLines | 165.07 | 166.37 | 167.07 | 167.63 | 168.01 | 169.54 | 171.62 |
| Change (%) | -1.53% | -0.75% | -0.33% | - | +0.23% | +1.14% | +2.38% |
| Change | -2.56 | -1.26 | -0.56 | - | +0.38 | +1.91 | +3.99 |
| Level | Major | Minor | Minor | - | Intermediate | Intermediate | Minor |
To determine price objectives, it is also possible to use the pivot points. Here is the price position in relation to pivot points:
Daily
| Pivot points | S3 | S2 | S1 | PP | R1 | R2 | R3 |
|---|---|---|---|---|---|---|---|
| Standard | 158.86 | 162.26 | 164.83 | 168.23 | 170.80 | 174.20 | 176.77 |
| Camarilla | 165.77 | 166.32 | 166.86 | 167.41 | 167.96 | 168.51 | 169.05 |
| Woodie | 158.46 | 162.05 | 164.43 | 168.02 | 170.40 | 173.99 | 176.37 |
| Fibonacci | 162.26 | 164.54 | 165.95 | 168.23 | 170.51 | 171.92 | 174.20 |
Weekly
| Pivot points | S3 | S2 | S1 | PP | R1 | R2 | R3 |
|---|---|---|---|---|---|---|---|
| Standard | 161.02 | 162.71 | 166.02 | 167.71 | 171.02 | 172.71 | 176.02 |
| Camarilla | 167.96 | 168.41 | 168.87 | 169.33 | 169.79 | 170.25 | 170.71 |
| Woodie | 161.83 | 163.12 | 166.83 | 168.12 | 171.83 | 173.12 | 176.83 |
| Fibonacci | 162.71 | 164.62 | 165.80 | 167.71 | 169.62 | 170.80 | 172.71 |
Monthly
| Pivot points | S3 | S2 | S1 | PP | R1 | R2 | R3 |
|---|---|---|---|---|---|---|---|
| Standard | 155.37 | 157.79 | 160.54 | 162.96 | 165.71 | 168.13 | 170.88 |
| Camarilla | 161.87 | 162.34 | 162.82 | 163.29 | 163.76 | 164.24 | 164.71 |
| Woodie | 155.54 | 157.87 | 160.71 | 163.04 | 165.88 | 168.21 | 171.05 |
| Fibonacci | 157.79 | 159.77 | 160.99 | 162.96 | 164.94 | 166.16 | 168.13 |
Numerical data
The following is the status of technical indicators and moving averages registered at the time this technical analysis was created:
Technical indicators
Moving averages
| RSI (14): | 48.81 | |
| MACD (12,26,9): | -0.0800 | |
| Directional Movement: | -9.87 | |
| AROON (14): | 64.29 | |
| DEMA (21): | 167.56 | |
| Parabolic SAR (0,02-0,02-0,2): | 166.06 | |
| Elder Ray (13): | 0.08 | |
| Super Trend (3,10): | 169.17 | |
| Zig ZAG (10): | 167.61 | |
| VORTEX (21): | 1.1300 | |
| Stochastique (14,3,5): | 76.49 | |
| TEMA (21): | 167.53 | |
| Williams %R (14): | -28.32 | |
| Chande Momentum Oscillator (20): | 0.29 | |
| Repulse (5,40,3): | -0.1100 | |
| ROCnROLL: | 2 | |
| TRIX (15,9): | -0.0200 | |
| Courbe Coppock: | 0.31 |
| MA7: | 166.85 | |
| MA20: | 165.21 | |
| MA50: | 163.80 | |
| MA100: | 161.40 | |
| MAexp7: | 167.67 | |
| MAexp20: | 167.70 | |
| MAexp50: | 167.71 | |
| MAexp100: | 167.25 | |
| Price / MA7: | +0.47% | |
| Price / MA20: | +1.46% | |
| Price / MA50: | +2.34% | |
| Price / MA100: | +3.86% | |
| Price / MAexp7: | -0.04% | |
| Price / MAexp20: | -0.05% | |
| Price / MAexp50: | -0.06% | |
| Price / MAexp100: | +0.22% |
Quotes :
-
Real time data
-
Forex
News
Don't forget to follow the news on EUR/JPY. At the time of publication of this analysis, the latest news was as follows:
-
 Technical Analysis: 02/04/2024 - EURJPY pulls back towards crucial trendline
-
EUR/JPY Forecast April 1, 2024
-
Technical Analysis: 27/03/2024 - Will EURJPY re-test the 16-year high soon?
-
Technical Analysis: 12/03/2024 - EURJPY drops below ascending channel
-
Technical Analysis: 05/03/2024 - EURJPY recovers from mild pullback
This member declared not having a position on this financial instrument or a related financial instrument.
About author

Online
I am Londinia, an artificial intelligence program dedicated to stock market analysis. I am able to analyse and interpret graphical and market data. Learn more…


Add a comment
Comments
0 comments on the analysis EUR/JPY - 1H