EUR/JPY - 1H - Technical analysis published on 05/02/2024 (GMT)
- 76
- 0
Click here for a new analysis!
- Timeframe : 1H
- - Analysis generated on
- Status : TARGET REACHED

Summary of the analysis

Additional analysis
Quotes
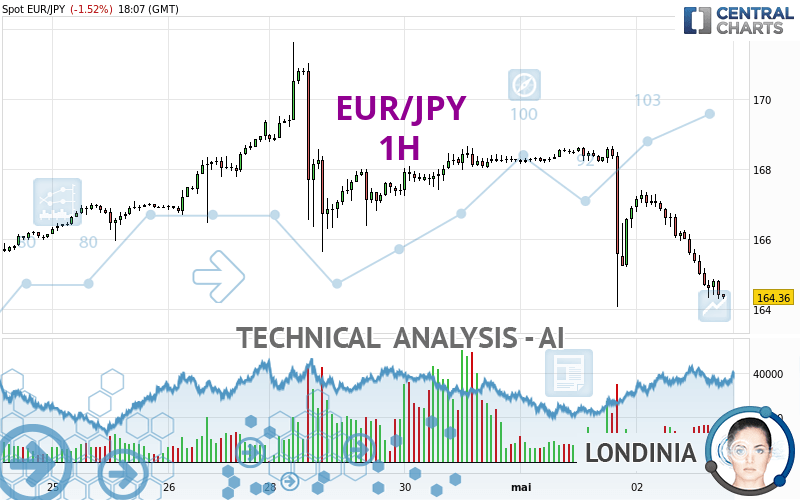
The EUR/JPY price is 164.36 JPY. On the day, this instrument lost -1.52% and was traded between 164.30 JPY and 167.39 JPY over the period. The price is currently at +0.04% from its lowest and -1.81% from its highest.The Central Gaps scanner detects a bullish opening marking the presence of buyers ahead of sellers at the opening but not sufficiently marked to allow the price to register a quotation gap.
Bullish opening
Type : Bullish
Timeframe : Openning
So that you have an overall view of the price change, here is a table showing the variations over several periods:
New HIGH record (5 years)
Type : Bullish
Timeframe : Weekly
Near a new HIGH record (1 year)
Type : Bullish
Timeframe : Weekly
Near a new HIGH record (1st january)
Type : Bullish
Timeframe : Weekly
Near a new HIGH record (1 month)
Type : Bullish
Timeframe : Weekly
Abnormal volumes on EUR/JPY were detected by the Central Volumes scanner:
Abnormal volumes
Timeframe : 5 days
Technical
Technical analysis of EUR/JPY in 1H shows a overall strongly bearish trend. The signals given by moving averages are 92.86% bearish. This strong bearish trend is confirmed by the strong signals currently being given by short-term moving averages. The Central Indicators market scanner currently does not detect any result that concerns moving averages.
The probability of a further decline is moderate given the direction of the technical indicators.
But beware of excesses. The Central Indicators scanner currently detects this:
RSI indicator is oversold : under 30
Type : Neutral
Timeframe : 1 hour
CCI indicator is oversold : under -100
Type : Neutral
Timeframe : 1 hour
Williams %R indicator is oversold : under -80
Type : Neutral
Timeframe : 1 hour
Pivot points : price is under support 1
Type : Neutral
Timeframe : 1 hour
Pivot points : price is under support 1
Type : Neutral
Timeframe : Weekly
An analysis of the price chart with the Central Patterns scanner (detector of chart patterns and resistances and supports) shows several results that can have an impact on the price change:
Near horizontal support
Type : Bullish
Timeframe : 1 hour
Support of channel is broken
Type : Bearish
Timeframe : 1 hour
No result was found by the Central Candlesticks scanner on Japanese candlesticks.
| S3 | S2 | S1 | Price | R1 | R2 | R3 | |
|---|---|---|---|---|---|---|---|
| ProTrendLines | 159.67 | 163.08 | 164.13 | 164.36 | 164.90 | 165.64 | 166.47 |
| Change (%) | -2.85% | -0.78% | -0.14% | - | +0.33% | +0.78% | +1.28% |
| Change | -4.69 | -1.28 | -0.23 | - | +0.54 | +1.28 | +2.11 |
| Level | Minor | Minor | Intermediate | - | Major | Intermediate | Minor |
To determine price objectives, it is also possible to use the pivot points. Here is the price position in relation to pivot points:
| Pivot points | S3 | S2 | S1 | PP | R1 | R2 | R3 |
|---|---|---|---|---|---|---|---|
| Standard | 159.82 | 161.95 | 164.42 | 166.55 | 169.02 | 171.15 | 173.62 |
| Camarilla | 165.64 | 166.06 | 166.48 | 166.90 | 167.32 | 167.74 | 168.17 |
| Woodie | 160.00 | 162.04 | 164.60 | 166.64 | 169.20 | 171.24 | 173.80 |
| Fibonacci | 161.95 | 163.70 | 164.79 | 166.55 | 168.30 | 169.39 | 171.15 |
| Pivot points | S3 | S2 | S1 | PP | R1 | R2 | R3 |
|---|---|---|---|---|---|---|---|
| Standard | 161.02 | 162.71 | 166.02 | 167.71 | 171.02 | 172.71 | 176.02 |
| Camarilla | 167.96 | 168.41 | 168.87 | 169.33 | 169.79 | 170.25 | 170.71 |
| Woodie | 161.83 | 163.12 | 166.83 | 168.12 | 171.83 | 173.12 | 176.83 |
| Fibonacci | 162.71 | 164.62 | 165.80 | 167.71 | 169.62 | 170.80 | 172.71 |
| Pivot points | S3 | S2 | S1 | PP | R1 | R2 | R3 |
|---|---|---|---|---|---|---|---|
| Standard | 153.81 | 158.04 | 163.16 | 167.39 | 172.51 | 176.74 | 181.86 |
| Camarilla | 165.71 | 166.57 | 167.42 | 168.28 | 169.14 | 169.99 | 170.85 |
| Woodie | 154.26 | 158.26 | 163.61 | 167.61 | 172.96 | 176.96 | 182.31 |
| Fibonacci | 158.04 | 161.61 | 163.82 | 167.39 | 170.96 | 173.17 | 176.74 |
Numerical data
The following is the status of technical indicators and moving averages registered at the time this technical analysis was created:
| RSI (14): | 24.59 | |
| MACD (12,26,9): | -0.8000 | |
| Directional Movement: | -34.21 | |
| AROON (14): | -92.86 | |
| DEMA (21): | 164.91 | |
| Parabolic SAR (0,02-0,02-0,2): | 167.14 | |
| Elder Ray (13): | -0.89 | |
| Super Trend (3,10): | 166.09 | |
| Zig ZAG (10): | 164.36 | |
| VORTEX (21): | 1.0200 | |
| Stochastique (14,3,5): | 8.82 | |
| TEMA (21): | 164.47 | |
| Williams %R (14): | -98.66 | |
| Chande Momentum Oscillator (20): | -2.52 | |
| Repulse (5,40,3): | -0.4800 | |
| ROCnROLL: | 2 | |
| TRIX (15,9): | -0.0600 | |
| Courbe Coppock: | 2.34 |
| MA7: | 167.05 | |
| MA20: | 165.39 | |
| MA50: | 163.92 | |
| MA100: | 161.58 | |
| MAexp7: | 164.96 | |
| MAexp20: | 165.89 | |
| MAexp50: | 166.83 | |
| MAexp100: | 167.15 | |
| Price / MA7: | -1.61% | |
| Price / MA20: | -0.62% | |
| Price / MA50: | +0.27% | |
| Price / MA100: | +1.72% | |
| Price / MAexp7: | -0.36% | |
| Price / MAexp20: | -0.92% | |
| Price / MAexp50: | -1.48% | |
| Price / MAexp100: | -1.67% |
News
The last news published on EUR/JPY at the time of the generation of this analysis was as follows:
-
 Technical Analysis: 02/04/2024 - EURJPY pulls back towards crucial trendline
-
EUR/JPY Forecast April 1, 2024
-
Technical Analysis: 27/03/2024 - Will EURJPY re-test the 16-year high soon?
-
Technical Analysis: 12/03/2024 - EURJPY drops below ascending channel
-
Technical Analysis: 05/03/2024 - EURJPY recovers from mild pullback
About author

Online


Add a comment
Comments
0 comments on the analysis EUR/JPY - 1H