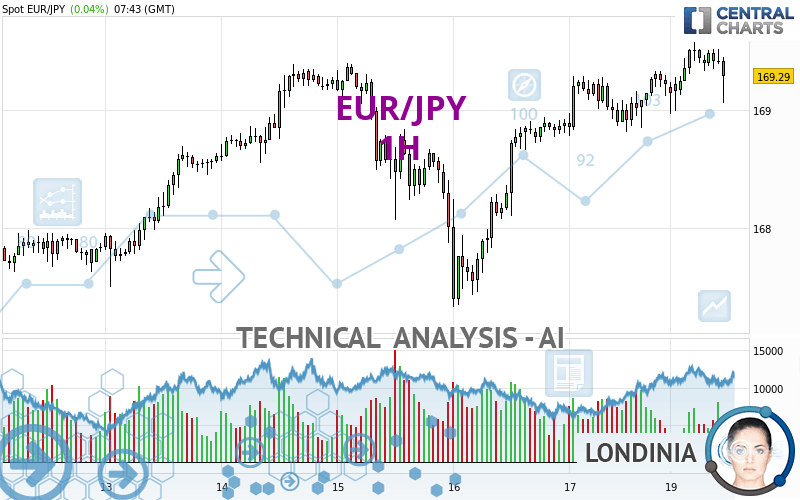
EUR/JPY - 1H - Technical analysis published on 05/20/2024 (GMT)
- 82
- 0
Click here for a new analysis!
- Timeframe : 1H
- - Analysis generated on
- Status : TARGET REACHED

Summary of the analysis

Additional analysis
Quotes
The EUR/JPY price is 169.29 JPY. The price has increased by +0.04% since the last closing and was traded between 168.97 JPY and 169.58 JPY over the period. The price is currently at +0.19% from its lowest and -0.17% from its highest.A bearish opening was detected by the Central Gaps scanner. Sellers are trying to impose a bearish trend in the very short term.
Bearish opening
Type : Bearish
Timeframe : Openning
A study of price movements over other periods shows the following variations:
Near a new HIGH record (5 years)
Type : Bullish
Timeframe : Weekly
Near a new HIGH record (1 year)
Type : Bullish
Timeframe : Weekly
Near a new HIGH record (1st january)
Type : Bullish
Timeframe : Weekly
Near a new LOW record (1 month)
Type : Bearish
Timeframe : Weekly
Technical
Technical analysis of this 1H chart of EUR/JPY indicates that the overall trend is bullish. 75.00% of the signals given by moving averages are bullish. Caution: the neutral signals currently given by the short-term moving averages indicate that this bullish trend is showing signs of running out of steam. The Central Indicators scanner detects bearish signals on moving averages that could impact this trend:
Bearish price crossover with Moving Average 20
Type : Bearish
Timeframe : 1 hour
Bearish price crossover with adaptative moving average 20
Type : Bearish
Timeframe : 1 hour
The technical indicators are generally neutral. They do not provide relevant information on the direction of future price movements.
Central Indicators, the scanner specialised in technical indicators, has identified these signals:
RSI indicator is back under 50
Type : Bearish
Timeframe : 1 hour
Parabolic SAR indicator bearish reversal
Type : Bearish
Timeframe : 1 hour
Price is back under the pivot point
Type : Bearish
Timeframe : 1 hour
Momentum indicator is back under 0
Type : Bearish
Timeframe : 1 hour
Williams %R indicator is back under -50
Type : Bearish
Timeframe : 1 hour
Central Patterns, the market scanner focusing on chart patterns, resistances and supports found this result:
Near resistance of channel
Type : Bearish
Timeframe : 1 hour
The Central Candlesticks scanner which studies Japanese candlesticks did not detect anything.
| S3 | S2 | S1 | Price | R1 | |
|---|---|---|---|---|---|
| ProTrendLines | 167.34 | 167.97 | 168.83 | 169.29 | 169.54 |
| Change (%) | -1.15% | -0.78% | -0.27% | - | +0.15% |
| Change | -1.95 | -1.32 | -0.46 | - | +0.25 |
| Level | Major | Minor | Minor | - | Major |
Attention could also be paid to pivot points to set price objectives:
| Pivot points | S3 | S2 | S1 | PP | R1 | R2 | R3 |
|---|---|---|---|---|---|---|---|
| Standard | 168.34 | 168.56 | 168.89 | 169.11 | 169.44 | 169.66 | 169.99 |
| Camarilla | 169.07 | 169.12 | 169.17 | 169.22 | 169.27 | 169.32 | 169.37 |
| Woodie | 168.40 | 168.59 | 168.95 | 169.14 | 169.50 | 169.69 | 170.05 |
| Fibonacci | 168.56 | 168.77 | 168.90 | 169.11 | 169.32 | 169.45 | 169.66 |
| Pivot points | S3 | S2 | S1 | PP | R1 | R2 | R3 |
|---|---|---|---|---|---|---|---|
| Standard | 165.83 | 166.58 | 167.90 | 168.65 | 169.97 | 170.72 | 172.04 |
| Camarilla | 168.65 | 168.84 | 169.03 | 169.22 | 169.41 | 169.60 | 169.79 |
| Woodie | 166.12 | 166.72 | 168.19 | 168.79 | 170.26 | 170.86 | 172.33 |
| Fibonacci | 166.58 | 167.37 | 167.86 | 168.65 | 169.44 | 169.93 | 170.72 |
| Pivot points | S3 | S2 | S1 | PP | R1 | R2 | R3 |
|---|---|---|---|---|---|---|---|
| Standard | 153.81 | 158.04 | 163.16 | 167.39 | 172.51 | 176.74 | 181.86 |
| Camarilla | 165.71 | 166.57 | 167.42 | 168.28 | 169.14 | 169.99 | 170.85 |
| Woodie | 154.26 | 158.26 | 163.61 | 167.61 | 172.96 | 176.96 | 182.31 |
| Fibonacci | 158.04 | 161.61 | 163.82 | 167.39 | 170.96 | 173.17 | 176.74 |
Numerical data
The following is the status of technical indicators and moving averages registered at the time this technical analysis was created:
| RSI (14): | 51.56 | |
| MACD (12,26,9): | 0.1200 | |
| Directional Movement: | -8.36 | |
| AROON (14): | 35.71 | |
| DEMA (21): | 169.45 | |
| Parabolic SAR (0,02-0,02-0,2): | 169.58 | |
| Elder Ray (13): | -0.10 | |
| Super Trend (3,10): | 168.94 | |
| Zig ZAG (10): | 169.28 | |
| VORTEX (21): | 1.0400 | |
| Stochastique (14,3,5): | 66.12 | |
| TEMA (21): | 169.45 | |
| Williams %R (14): | -49.18 | |
| Chande Momentum Oscillator (20): | 0.06 | |
| Repulse (5,40,3): | -0.0700 | |
| ROCnROLL: | -1 | |
| TRIX (15,9): | 0.0100 | |
| Courbe Coppock: | 0.29 |
| MA7: | 168.72 | |
| MA20: | 167.38 | |
| MA50: | 165.18 | |
| MA100: | 162.93 | |
| MAexp7: | 169.38 | |
| MAexp20: | 169.29 | |
| MAexp50: | 169.06 | |
| MAexp100: | 168.78 | |
| Price / MA7: | +0.34% | |
| Price / MA20: | +1.14% | |
| Price / MA50: | +2.49% | |
| Price / MA100: | +3.90% | |
| Price / MAexp7: | -0.05% | |
| Price / MAexp20: | -0% | |
| Price / MAexp50: | +0.14% | |
| Price / MAexp100: | +0.30% |
News
Don't forget to follow the news on EUR/JPY. At the time of publication of this analysis, the latest news was as follows:
-
 Technical Analysis: 02/04/2024 - EURJPY pulls back towards crucial trendline
-
EUR/JPY Forecast April 1, 2024
-
Technical Analysis: 27/03/2024 - Will EURJPY re-test the 16-year high soon?
-
Technical Analysis: 12/03/2024 - EURJPY drops below ascending channel
-
Technical Analysis: 05/03/2024 - EURJPY recovers from mild pullback
About author

Online


Add a comment
Comments
0 comments on the analysis EUR/JPY - 1H