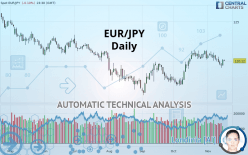
EUR/JPY - Daily - Technical analysis published on 11/17/2019 (GMT)
- Who voted?
- 152
- 0
- Timeframe : Daily
- - Analysis generated on
- Status : NEUTRAL

Summary of the analysis
Trends
Court terme:
Neutral
De fond:
Slightly bullish
Technical indicators
22%
28%
50%
My opinion
Neutral between 119.73 JPY and 121.33 JPY
My targets
-
My analysis
The neutral short-term trend shows a weakening of the basic, slightly bullish trend on EUR/JPY. It is difficult to advise a trading direction under these conditions. The first resistance is located at 121.33 JPY. The first support is located at 119.73 JPY. We can stay away while waiting for a more pronounced price movement on this instrument. A new analysis could then be produced that would give clearer signals.
In the very short term, the neutral opinion of this analysis is confirmed by technical indicators which are also neutral.
Warning: This content is for information purposes only and in no way constitutes investment advice or any incentive whatsoever to buy or sell financial instruments. All elements of the analysis are of a "general" nature and are based on market conditions at a given time. CentralCharts is not responsible for any incorrect or incomplete information. Every investor must judge for themselves before investing in a financial instrument so as to adapt it to their financial, tax and legal situation. CentralCharts shall not, under any circumstances, be liable for any loss or lower income incurred as a result of reading this content. Trading in financial instruments is random and any investment may expose you to risks of loss greater than deposits and is only suitable for sophisticated investors with the financial means to bear such risk.

This analysis was given by hsokkar. Take part yourself by sharing additional analysis on another time unit:
Additional analysis
Quotes
EUR/JPY rating 120.13 JPY. On the day, this instrument lost -0.09% with the lowest point at 120.12 JPY and the highest point at 120.28 JPY. The deviation from the price is +0.01% for the low point and -0.12% for the high point.120.12
120.28
120.13
The Central Gaps scanner detects a bearish opening marking the presence of sellers ahead of buyers at the opening but not sufficiently marked to allow the price to register a quotation gap.
Bearish opening
Type : Bearish
Timeframe : Openning
A study of price movements over other periods shows the following variations:
Near a new LOW record (1st january)
Type : Bearish
Timeframe : Weekly
Technical
Technical analysis of EUR/JPY in Daily shows an overall slightly bullish trend. 57.14% of the signals given by moving averages are bullish. As the signals currently given by short-term moving averages are rather neutral, the slightly bullish trend could return to neutral. The Central Indicators scanner detects bullish signals on moving averages that could impact this trend:
Bullish trend reversal : adaptative moving average 50
Type : Bullish
Timeframe : Daily
Bullish trend reversal : adaptative moving average 100
Type : Bullish
Timeframe : Daily
The technical indicators are generally neutral. They do not provide relevant information on the direction of future price movements.
But beware of excesses. The Central Indicators scanner currently detects this:
CCI indicator is oversold : under -100
Type : Neutral
Timeframe : Daily
Previous candle closed under Bollinger bands
Type : Neutral
Timeframe : Daily
RSI indicator is back over 50
Type : Bullish
Timeframe : Daily
Price is back over the pivot point
Type : Bullish
Timeframe : Daily
No signals are given by Central Patterns, a market scanner specialised in chart patterns, resistances and supports.
The Central Candlesticks scanner, specialised in Japanese candlesticks, did not identify any signals.
ProTrendLines
S3
S2
S1
R1
R2
R3
Price
| S3 | S2 | S1 | Price | R1 | R2 | R3 | |
|---|---|---|---|---|---|---|---|
| ProTrendLines | 116.15 | 117.21 | 119.73 | 120.13 | 121.33 | 122.69 | 124.25 |
| Change (%) | -3.31% | -2.43% | -0.33% | - | +1.00% | +2.13% | +3.43% |
| Change | -3.98 | -2.92 | -0.40 | - | +1.20 | +2.56 | +4.12 |
| Level | Intermediate | Major | Major | - | Intermediate | Minor | Intermediate |
Pivot points can also be used to set your price objectives. Here is the price situation in relation to pivot points:
Daily
| Pivot points | S3 | S2 | S1 | PP | R1 | R2 | R3 |
|---|---|---|---|---|---|---|---|
| Standard | 118.97 | 119.25 | 119.75 | 120.03 | 120.53 | 120.81 | 121.31 |
| Camarilla | 120.03 | 120.10 | 120.17 | 120.24 | 120.31 | 120.38 | 120.46 |
| Woodie | 119.07 | 119.31 | 119.85 | 120.09 | 120.63 | 120.87 | 121.41 |
| Fibonacci | 119.25 | 119.55 | 119.74 | 120.03 | 120.33 | 120.52 | 120.81 |
Weekly
| Pivot points | S3 | S2 | S1 | PP | R1 | R2 | R3 |
|---|---|---|---|---|---|---|---|
| Standard | 118.06 | 118.65 | 119.45 | 120.04 | 120.84 | 121.43 | 122.23 |
| Camarilla | 119.86 | 119.99 | 120.11 | 120.24 | 120.37 | 120.50 | 120.62 |
| Woodie | 118.16 | 118.70 | 119.55 | 120.09 | 120.94 | 121.48 | 122.33 |
| Fibonacci | 118.65 | 119.18 | 119.51 | 120.04 | 120.57 | 120.90 | 121.43 |
Monthly
| Pivot points | S3 | S2 | S1 | PP | R1 | R2 | R3 |
|---|---|---|---|---|---|---|---|
| Standard | 113.44 | 115.24 | 117.87 | 119.67 | 122.30 | 124.10 | 126.73 |
| Camarilla | 119.27 | 119.68 | 120.08 | 120.49 | 120.90 | 121.30 | 121.71 |
| Woodie | 113.85 | 115.45 | 118.28 | 119.88 | 122.71 | 124.31 | 127.14 |
| Fibonacci | 115.24 | 116.94 | 117.98 | 119.67 | 121.37 | 122.41 | 124.10 |
Numerical data
The following is the status of technical indicators and moving averages registered at the time this technical analysis was created:
Technical indicators
Moving averages
| RSI (14): | 50.65 | |
| MACD (12,26,9): | 0.1200 | |
| Directional Movement: | 3.89 | |
| AROON (14): | -71.42 | |
| DEMA (21): | 120.48 | |
| Parabolic SAR (0,02-0,02-0,2): | 120.59 | |
| Elder Ray (13): | -0.04 | |
| Super Trend (3,10): | 119.04 | |
| Zig ZAG (10): | 120.15 | |
| VORTEX (21): | 0.9600 | |
| Stochastique (14,3,5): | 33.03 | |
| TEMA (21): | 120.25 | |
| Williams %R (14): | -59.64 | |
| Chande Momentum Oscillator (20): | -0.34 | |
| Repulse (5,40,3): | 0.1700 | |
| ROCnROLL: | -1 | |
| TRIX (15,9): | 0.0400 | |
| Courbe Coppock: | 1.16 |
| MA7: | 120.07 | |
| MA20: | 120.55 | |
| MA50: | 119.52 | |
| MA100: | 119.49 | |
| MAexp7: | 120.14 | |
| MAexp20: | 120.22 | |
| MAexp50: | 119.83 | |
| MAexp100: | 120.12 | |
| Price / MA7: | +0.05% | |
| Price / MA20: | -0.35% | |
| Price / MA50: | +0.51% | |
| Price / MA100: | +0.54% | |
| Price / MAexp7: | -0.01% | |
| Price / MAexp20: | -0.07% | |
| Price / MAexp50: | +0.25% | |
| Price / MAexp100: | +0.01% |
News
Don"t forget to follow the news on EUR/JPY. At the time of publication of this analysis, the latest news was as follows:
-
 Weekly Technical Analysis: 04/11/2019 - GBPUSD, EURJPY, NZDUSD
-
FX Price Action Setups in EUR/USD, USD/CAD, EUR/JPY and GBP/JPY
-
Weekly Technical Analysis: 08/07/2019 - EURJPY, GBPUSD, NZDUSD
-
Weekly Technical Analysis: 10/06/2019 - GBPUSD, EURJPY, USDCHF
-
Weekly Technical Analysis: 20/05/2019 - USDJPY, GBPUSD, EURJPY
This member declared not having a position on this financial instrument or a related financial instrument.
About author

Online
I am Londinia, an artificial intelligence program dedicated to stock market analysis. I am able to analyse and interpret graphical and market data. Learn more…


Add a comment
Comments
0 comments on the analysis EUR/JPY - Daily