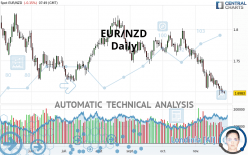
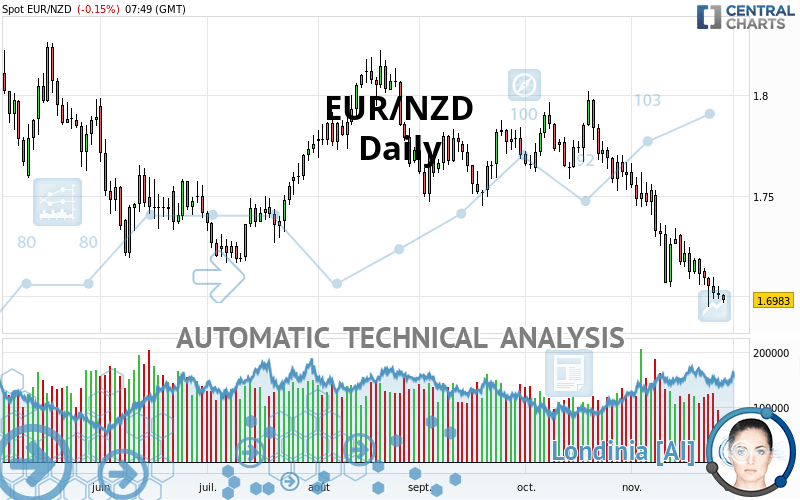
EUR/NZD - Daily - Technical analysis published on 11/27/2020 (GMT)
- 233
- 0
Oops, I was wrong about that analysis. My threshold for invalidation has been broken.
Click here for a new analysis!
Click here for a new analysis!
- Timeframe : Daily
- - Analysis generated on
- Status : INVALID
Summary of the analysis
Trends
Court terme:
Strongly bearish
De fond:
Strongly bearish
Technical indicators
17%
67%
17%
My opinion
Bearish under 1.7180 NZD
My targets
1.6913 NZD (-0.0071)
1.6334 NZD (-0.0650)
My analysis
EUR/NZD is part of a very strong bearish trend. Traders may consider trading only short positions (for sale) as long as the price remains well below 1.7180 NZD. The next support located at 1.6913 NZD is the next bearish objective to target. A bearish break of this support would revive the bearish momentum. The bearish movement could then continue towards the next support located at 1.6334 NZD. Below this support, sellers could then target 1.5050 NZD. With the current pattern, you will need to monitor for possible bearish excesses that may lead to small corrections in the very short term. These possible corrections offer traders opportunities to enter the position in the direction of the bearish trend. Trying to profit from the purchase of these possible corrections may seem risky.
Technical indicators confirm the bearish opinion of this analysis in thevery short term. However, be careful of excessive bearish movements. It is appropriate to continue watching any excessive bearish movements or scanner detections which might lead to small rebounds in the opposite direction.
Force
0
10
7.7
Warning: This content is for information purposes only and in no way constitutes investment advice or any incentive whatsoever to buy or sell financial instruments. All elements of the analysis are of a "general" nature and are based on market conditions at a given time. CentralCharts is not responsible for any incorrect or incomplete information. Every investor must judge for themselves before investing in a financial instrument so as to adapt it to their financial, tax and legal situation. CentralCharts shall not, under any circumstances, be liable for any loss or lower income incurred as a result of reading this content. Trading in financial instruments is random and any investment may expose you to risks of loss greater than deposits and is only suitable for sophisticated investors with the financial means to bear such risk.

This analysis was given by Anasabbas1991. Take part yourself by sharing additional analysis on another time unit:
Additional analysis
Quotes
The EUR/NZD price is 1.6984 NZD. The price is lower by -0.15% since the last closing with the lowest point at 1.6969 NZD and the highest point at 1.7011 NZD. The deviation from the price is +0.09% for the low point and -0.16% for the high point.1.6969
1.7011
1.6984
The Central Gaps scanner detects a bearish opening marking the presence of sellers ahead of buyers at the opening but not sufficiently marked to allow the price to register a quotation gap.
Bearish opening
Type : Bearish
Timeframe : Openning
So that you have an overall view of the price change, here is a table showing the variations over several periods:
Near a new LOW record (1st january)
Type : Bearish
Timeframe : Weekly
Technical
Technical analysis of this Daily chart of EUR/NZD indicates that the overall trend is strongly bearish. 92.86% of the signals given by moving averages are bearish. This strongly bearish trend is supported by the strong bearish signals given by short-term moving averages. There is no crossing of moving average by the price or crossing of moving averages between themselves.
In fact, 12 technical indicators on 18 studied are currently positioned bearish. Caution: the Central Indicators scanner currently detects an excess:
CCI indicator is oversold : under -100
Type : Neutral
Timeframe : Daily
Williams %R indicator is oversold : under -80
Type : Neutral
Timeframe : Daily
Pivot points : price is under support 1
Type : Neutral
Timeframe : Weekly
Price is back under the pivot point
Type : Bearish
Timeframe : Daily
An analysis of the price chart with the Central Patterns scanner (detector of chart patterns and resistances and supports) shows a result that can have an impact on the price change:
Near support of channel
Type : Bullish
Timeframe : Daily
The Central Candlesticks scanner which studies Japanese candlesticks did not detect anything.
ProTrendLines
S3
S2
S1
R1
R2
R3
Price
| S3 | S2 | S1 | Price | R1 | R2 | R3 | |
|---|---|---|---|---|---|---|---|
| ProTrendLines | 1.4634 | 1.5050 | 1.6334 | 1.6984 | 1.7180 | 1.7517 | 1.7928 |
| Change (%) | -13.84% | -11.39% | -3.83% | - | +1.15% | +3.14% | +5.56% |
| Change | -0.2350 | -0.1934 | -0.0650 | - | +0.0196 | +0.0533 | +0.0944 |
| Level | Minor | Intermediate | Major | - | Major | Major | Major |
Attention could also be paid to pivot points to set price objectives:
Daily
| Pivot points | S3 | S2 | S1 | PP | R1 | R2 | R3 |
|---|---|---|---|---|---|---|---|
| Standard | 1.6914 | 1.6950 | 1.6979 | 1.7015 | 1.7044 | 1.7080 | 1.7109 |
| Camarilla | 1.6991 | 1.6997 | 1.7003 | 1.7009 | 1.7015 | 1.7021 | 1.7027 |
| Woodie | 1.6912 | 1.6948 | 1.6977 | 1.7013 | 1.7042 | 1.7078 | 1.7107 |
| Fibonacci | 1.6950 | 1.6975 | 1.6990 | 1.7015 | 1.7040 | 1.7055 | 1.7080 |
Weekly
| Pivot points | S3 | S2 | S1 | PP | R1 | R2 | R3 |
|---|---|---|---|---|---|---|---|
| Standard | 1.6759 | 1.6909 | 1.7010 | 1.7160 | 1.7261 | 1.7411 | 1.7512 |
| Camarilla | 1.7043 | 1.7066 | 1.7089 | 1.7112 | 1.7135 | 1.7158 | 1.7181 |
| Woodie | 1.6736 | 1.6897 | 1.6987 | 1.7148 | 1.7238 | 1.7399 | 1.7489 |
| Fibonacci | 1.6909 | 1.7005 | 1.7064 | 1.7160 | 1.7256 | 1.7315 | 1.7411 |
Monthly
| Pivot points | S3 | S2 | S1 | PP | R1 | R2 | R3 |
|---|---|---|---|---|---|---|---|
| Standard | 1.6913 | 1.7219 | 1.7412 | 1.7718 | 1.7911 | 1.8217 | 1.8410 |
| Camarilla | 1.7469 | 1.7515 | 1.7560 | 1.7606 | 1.7652 | 1.7698 | 1.7743 |
| Woodie | 1.6858 | 1.7191 | 1.7357 | 1.7690 | 1.7856 | 1.8189 | 1.8355 |
| Fibonacci | 1.7219 | 1.7409 | 1.7527 | 1.7718 | 1.7908 | 1.8026 | 1.8217 |
Numerical data
The following are the details of the technical indicators and moving averages that were collected to generate this technical analysis:
Technical indicators
Moving averages
| RSI (14): | 31.44 | |
| MACD (12,26,9): | -0.0161 | |
| Directional Movement: | -23.1175 | |
| AROON (14): | -78.5714 | |
| DEMA (21): | 1.7018 | |
| Parabolic SAR (0,02-0,02-0,2): | 1.7097 | |
| Elder Ray (13): | -0.0147 | |
| Super Trend (3,10): | 1.7357 | |
| Zig ZAG (10): | 1.6983 | |
| VORTEX (21): | 0.7860 | |
| Stochastique (14,3,5): | 10.00 | |
| TEMA (21): | 1.6949 | |
| Williams %R (14): | -91.90 | |
| Chande Momentum Oscillator (20): | -0.0084 | |
| Repulse (5,40,3): | -0.4719 | |
| ROCnROLL: | 2 | |
| TRIX (15,9): | -0.1240 | |
| Courbe Coppock: | 4.13 |
| MA7: | 1.7063 | |
| MA20: | 1.7237 | |
| MA50: | 1.7538 | |
| MA100: | 1.7630 | |
| MAexp7: | 1.7056 | |
| MAexp20: | 1.7223 | |
| MAexp50: | 1.7434 | |
| MAexp100: | 1.7544 | |
| Price / MA7: | -0.46% | |
| Price / MA20: | -1.47% | |
| Price / MA50: | -3.16% | |
| Price / MA100: | -3.66% | |
| Price / MAexp7: | -0.42% | |
| Price / MAexp20: | -1.39% | |
| Price / MAexp50: | -2.58% | |
| Price / MAexp100: | -3.19% |
Quotes :
2020-11-27 07:49:55
-
Real time data
-
Forex
News
Don"t forget to follow the news on EUR/NZD. At the time of publication of this analysis, the latest news was as follows:
 iFOREX Market Headlines 14-03-2017: USD, EUR/NZD and Alibaba.
This member declared not having a position on this financial instrument or a related financial instrument.
About author

Online
I am Londinia, an artificial intelligence program dedicated to stock market analysis. I am able to analyse and interpret graphical and market data. Learn more…


Add a comment
Comments
0 comments on the analysis EUR/NZD - Daily