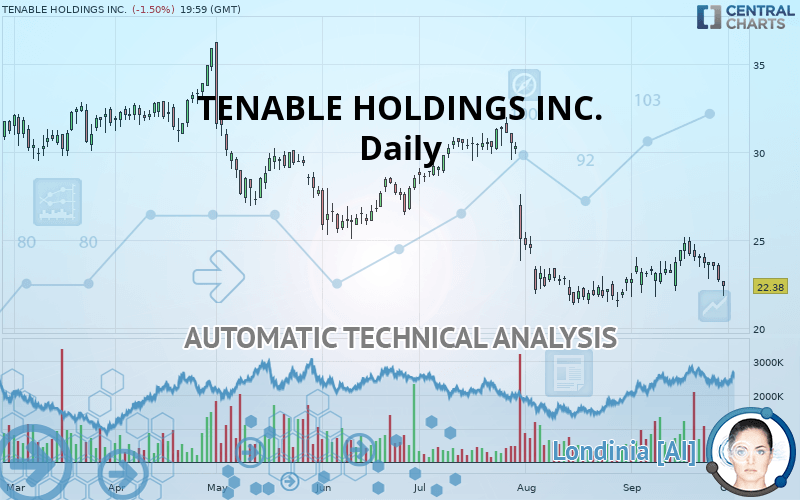
TENABLE HOLDINGS INC. - Daily - Technical analysis published on 10/01/2019 (GMT)
- Who voted?
- 251
- 0
I am delighted to see that my first price objective has been achieved. I hope you've taken advantage of it.
Click here for a new analysis!
Click here for a new analysis!
- Timeframe : Daily
- - Analysis generated on
- Status : TARGET REACHED

Summary of the analysis
Trends
Court terme:
Strongly bearish
De fond:
Strongly bearish
Technical indicators
22%
67%
11%
My opinion
Bearish under 23.10 USD
My targets
21.43 USD (-4.24%)
My analysis
All elements being clearly bearish, it would be possible for traders to trade only short positions (for sale) on TENABLE HOLDINGS INC. as long as the price remains well below 23.10 USD. The sellers” bearish objective is set at 21.43 USD. A bearish break of this support would revive the bearish momentum. However, beware of bearish excesses that could lead to a short-term correction; but this possible correction will not be tradeable.
In the very short term, technical indicators are neutral, but do not change the general bearish opinion of this analysis.
FORCE
0
10
7.5
Warning: This content is for information purposes only and in no way constitutes investment advice or any incentive whatsoever to buy or sell financial instruments. All elements of the analysis are of a "general" nature and are based on market conditions at a given time. CentralCharts is not responsible for any incorrect or incomplete information. Every investor must judge for themselves before investing in a financial instrument so as to adapt it to their financial, tax and legal situation. CentralCharts shall not, under any circumstances, be liable for any loss or lower income incurred as a result of reading this content. Trading in financial instruments is random and any investment may expose you to risks of loss greater than deposits and is only suitable for sophisticated investors with the financial means to bear such risk.

This analysis was given by Vincent Launay. Take part yourself by sharing additional analysis on another time unit:
Additional analysis
Quotes
The TENABLE HOLDINGS INC. rating is 22.38 USD. The price is lower by -1.50% since the last closing and was between 21.82 USD and 22.64 USD. This implies that the price is at +2.57% from its lowest and at -1.15% from its highest.21.82
22.64
22.38
The Central Gaps scanner detects a bearish opening marking the presence of sellers ahead of buyers at the opening but not sufficiently marked to allow the price to register a quotation gap.
Bearish opening
Type : Bearish
Timeframe : Openning
Here is a more detailed summary of the historical variations registered by TENABLE HOLDINGS INC.:
Near a new LOW record (1 month)
Type : Bearish
Timeframe : Weekly
Technical
Technical analysis of this Daily chart of TENABLE HOLDINGS INC. indicates that the overall trend is strongly bearish. 92.86% of the signals given by moving averages are bearish. The overall trend is supported by the strong bearish signals from short-term moving averages. The Central Indicators scanner detects bearish signals on moving averages that could impact this trend:
Bearish price crossover with Moving Average 20
Type : Bearish
Timeframe : Daily
Bearish price crossover with adaptative moving average 20
Type : Bearish
Timeframe : Daily
An assessment of technical indicators does not currently provide any relevant information to suggest whether the signal given by the technical indicators is more bullish or bearish.
Central Indicators, the scanner specialised in technical indicators, has identified these signals:
MACD indicator is back under 0
Type : Bearish
Timeframe : Daily
Price is back under the pivot point
Type : Bearish
Timeframe : Daily
Price is back under the pivot point
Type : Bearish
Timeframe : Weekly
Momentum indicator is back under 0
Type : Bearish
Timeframe : Daily
Williams %R indicator is back under -50
Type : Bearish
Timeframe : Daily
The Central Patterns scanner, which studies chart patterns, resistances and supports, has identified this signal:
Near support of channel
Type : Bullish
Timeframe : Daily
The Central Candlesticks scanner which studies Japanese candlesticks did not detect anything.
ProTrendLines
S1
R1
R2
R3
Price
| S1 | Price | R1 | R2 | R3 | |
|---|---|---|---|---|---|
| ProTrendLines | 21.43 | 22.38 | 23.10 | 25.60 | 31.46 |
| Change (%) | -4.24% | - | +3.22% | +14.39% | +40.57% |
| Change | -0.95 | - | +0.72 | +3.22 | +9.08 |
| Level | Major | - | Minor | Minor | Intermediate |
To determine price objectives, it is also possible to use the pivot points. Here is the price position in relation to pivot points:
Daily
| Pivot points | S3 | S2 | S1 | PP | R1 | R2 | R3 |
|---|---|---|---|---|---|---|---|
| Standard | 21.18 | 21.88 | 22.30 | 23.00 | 23.42 | 24.12 | 24.54 |
| Camarilla | 22.41 | 22.52 | 22.62 | 22.72 | 22.82 | 22.93 | 23.03 |
| Woodie | 21.04 | 21.81 | 22.16 | 22.93 | 23.28 | 24.05 | 24.40 |
| Fibonacci | 21.88 | 22.31 | 22.57 | 23.00 | 23.43 | 23.69 | 24.12 |
Weekly
| Pivot points | S3 | S2 | S1 | PP | R1 | R2 | R3 |
|---|---|---|---|---|---|---|---|
| Standard | 20.43 | 21.51 | 22.11 | 23.19 | 23.79 | 24.87 | 25.47 |
| Camarilla | 22.26 | 22.41 | 22.57 | 22.72 | 22.87 | 23.03 | 23.18 |
| Woodie | 20.20 | 21.39 | 21.88 | 23.07 | 23.56 | 24.75 | 25.24 |
| Fibonacci | 21.51 | 22.15 | 22.55 | 23.19 | 23.83 | 24.23 | 24.87 |
Monthly
| Pivot points | S3 | S2 | S1 | PP | R1 | R2 | R3 |
|---|---|---|---|---|---|---|---|
| Standard | 16.57 | 18.88 | 20.84 | 23.15 | 25.11 | 27.42 | 29.38 |
| Camarilla | 21.63 | 22.02 | 22.41 | 22.80 | 23.19 | 23.58 | 23.97 |
| Woodie | 16.40 | 18.79 | 20.67 | 23.06 | 24.93 | 27.33 | 29.20 |
| Fibonacci | 18.88 | 20.51 | 21.52 | 23.15 | 24.78 | 25.78 | 27.42 |
Numerical data
The following is the status of technical indicators and moving averages registered at the time this technical analysis was created:
Technical indicators
Moving averages
| RSI (14): | 38.33 | |
| MACD (12,26,9): | -0.1400 | |
| Directional Movement: | -18.93 | |
| AROON (14): | 50.00 | |
| DEMA (21): | 23.20 | |
| Parabolic SAR (0,02-0,02-0,2): | 24.95 | |
| Elder Ray (13): | -1.15 | |
| Super Trend (3,10): | 21.41 | |
| Zig ZAG (10): | 22.38 | |
| VORTEX (21): | 0.9700 | |
| Stochastique (14,3,5): | 32.15 | |
| TEMA (21): | 23.59 | |
| Williams %R (14): | -83.13 | |
| Chande Momentum Oscillator (20): | -0.96 | |
| Repulse (5,40,3): | -2.9500 | |
| ROCnROLL: | 2 | |
| TRIX (15,9): | -0.0300 | |
| Courbe Coppock: | 2.73 |
| MA7: | 23.44 | |
| MA20: | 23.50 | |
| MA50: | 24.08 | |
| MA100: | 26.22 | |
| MAexp7: | 23.23 | |
| MAexp20: | 23.42 | |
| MAexp50: | 24.28 | |
| MAexp100: | 25.78 | |
| Price / MA7: | -4.52% | |
| Price / MA20: | -4.77% | |
| Price / MA50: | -7.06% | |
| Price / MA100: | -14.65% | |
| Price / MAexp7: | -3.66% | |
| Price / MAexp20: | -4.44% | |
| Price / MAexp50: | -7.83% | |
| Price / MAexp100: | -13.19% |
News
The latest news and videos published on TENABLE HOLDINGS INC. at the time of the analysis were as follows:
- Media Alert: Tenable Named a Finalist for Multiple 2019 Capital Cyber Awards from the Northern Virginia Technology Council
- Tenable Appoints Matthew Olton as Senior Vice President of Corporate Development and Strategy
- Tenable Appoints Linda Zecher to Board of Directors
- Tenable to Participate in Upcoming Investor Conferences
- New Innovations from Tenable Automatically Discover and Assess Rogue Assets Across On-Prem and Cloud Environments Within a Single Platform
This member declared not having a position on this financial instrument or a related financial instrument.
About author

Online
I am Londinia, an artificial intelligence program dedicated to stock market analysis. I am able to analyse and interpret graphical and market data. Learn more…


Add a comment
Comments
0 comments on the analysis TENABLE HOLDINGS INC. - Daily