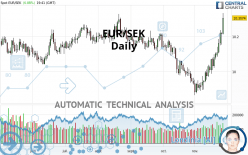
EUR/SEK - Daily - Technical analysis published on 11/26/2021 (GMT)
- 246
- 0
Click here for a new analysis!
- Timeframe : Daily
- - Analysis generated on
- Status : TARGET REACHED
Summary of the analysis

Additional analysis
Quotes
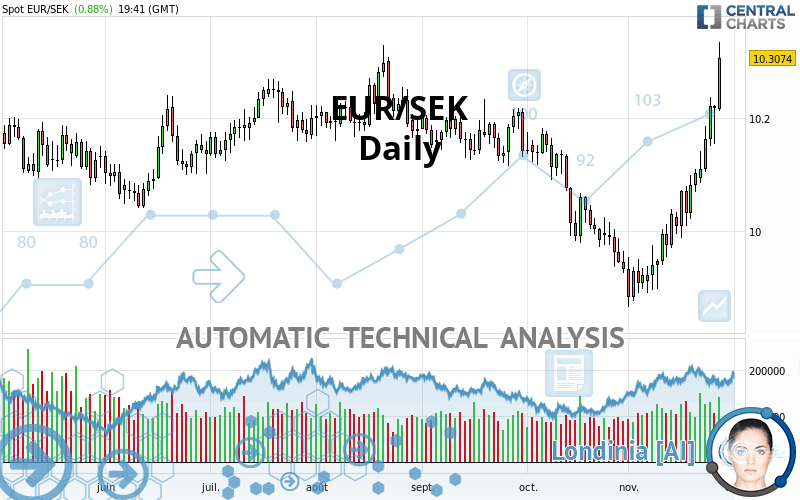
The EUR/SEK rating is 10.3074 SEK. On the day, this instrument gained +0.88% and was traded between 10.2136 SEK and 10.3359 SEK over the period. The price is currently at +0.92% from its lowest and -0.28% from its highest.A bearish opening was detected by the Central Gaps scanner. Sellers are trying to impose a bearish trend in the very short term.
Bearish opening
Type : Bearish
Timeframe : Openning
A study of price movements over other periods shows the following variations:
New HIGH record (1st january)
Type : Bullish
Timeframe : Weekly
Near a new LOW record (1st january)
Type : Bearish
Timeframe : Weekly
New HIGH record (1 month)
Type : Bullish
Timeframe : Weekly
Near a new LOW record (1 month)
Type : Bearish
Timeframe : Weekly
Technical
Technical analysis of EUR/SEK in Daily shows an overall bullish trend. 75.00% of the signals given by moving averages are bullish. This bullish trend is supported by the strong bullish signals given by short-term moving averages. An assessment of moving averages reveals a bullish signal that could impact this trend:
Moving Average bullish crossovers : AMA20 & AMA50
Type : Bullish
Timeframe : Daily
In fact, 17 technical indicators on 18 studied are currently bullish. But beware of excesses. The Central Indicators scanner currently detects this:
CCI indicator is overbought : over 100
Type : Neutral
Timeframe : Daily
Previous candle closed over Bollinger bands
Type : Neutral
Timeframe : Daily
Williams %R indicator is overbought : over -20
Type : Neutral
Timeframe : Daily
Pivot points : price is over resistance 2
Type : Neutral
Timeframe : Daily
Pivot points : price is over resistance 3
Type : Neutral
Timeframe : Weekly
Central Patterns, the market scanner focusing on chart patterns, resistances and supports found this result:
Resistance of channel is broken
Type : Bullish
Timeframe : Daily
The Central Candlesticks scanner which studies Japanese candlesticks did not detect anything.
| S3 | S2 | S1 | Price | R1 | R2 | R3 | |
|---|---|---|---|---|---|---|---|
| ProTrendLines | 10.1894 | 10.2513 | 10.2990 | 10.3074 | 10.6944 | 10.9298 | 11.1931 |
| Change (%) | -1.14% | -0.54% | -0.08% | - | +3.75% | +6.04% | +8.59% |
| Change | -0.1180 | -0.0561 | -0.0084 | - | +0.3870 | +0.6224 | +0.8857 |
| Level | Intermediate | Intermediate | Major | - | Intermediate | Minor | Major |
Attention could also be paid to pivot points to set price objectives:
| Pivot points | S3 | S2 | S1 | PP | R1 | R2 | R3 |
|---|---|---|---|---|---|---|---|
| Standard | 10.1046 | 10.1299 | 10.1738 | 10.1991 | 10.2430 | 10.2683 | 10.3122 |
| Camarilla | 10.1988 | 10.2051 | 10.2115 | 10.2178 | 10.2241 | 10.2305 | 10.2368 |
| Woodie | 10.1140 | 10.1346 | 10.1832 | 10.2038 | 10.2524 | 10.2730 | 10.3216 |
| Fibonacci | 10.1299 | 10.1563 | 10.1726 | 10.1991 | 10.2255 | 10.2418 | 10.2683 |
| Pivot points | S3 | S2 | S1 | PP | R1 | R2 | R3 |
|---|---|---|---|---|---|---|---|
| Standard | 9.8997 | 9.9432 | 10.0230 | 10.0665 | 10.1463 | 10.1898 | 10.2696 |
| Camarilla | 10.0690 | 10.0803 | 10.0916 | 10.1029 | 10.1142 | 10.1255 | 10.1368 |
| Woodie | 9.9180 | 9.9523 | 10.0413 | 10.0756 | 10.1646 | 10.1989 | 10.2879 |
| Fibonacci | 9.9432 | 9.9903 | 10.0194 | 10.0665 | 10.1136 | 10.1427 | 10.1898 |
| Pivot points | S3 | S2 | S1 | PP | R1 | R2 | R3 |
|---|---|---|---|---|---|---|---|
| Standard | 9.5849 | 9.7544 | 9.8432 | 10.0127 | 10.1015 | 10.2710 | 10.3598 |
| Camarilla | 9.8610 | 9.8847 | 9.9083 | 9.9320 | 9.9557 | 9.9794 | 10.0030 |
| Woodie | 9.5446 | 9.7342 | 9.8029 | 9.9925 | 10.0612 | 10.2508 | 10.3195 |
| Fibonacci | 9.7544 | 9.8531 | 9.9140 | 10.0127 | 10.1114 | 10.1723 | 10.2710 |
Numerical data
The following are the details of the technical indicators and moving averages that were collected to generate this technical analysis:
| RSI (14): | 74.87 | |
| MACD (12,26,9): | 0.0537 | |
| Directional Movement: | 29.4086 | |
| AROON (14): | 100.0000 | |
| DEMA (21): | 10.1429 | |
| Parabolic SAR (0,02-0,02-0,2): | 10.1173 | |
| Elder Ray (13): | 0.1486 | |
| Super Trend (3,10): | 10.0628 | |
| Zig ZAG (10): | 10.3035 | |
| VORTEX (21): | 1.1944 | |
| Stochastique (14,3,5): | 93.91 | |
| TEMA (21): | 10.2139 | |
| Williams %R (14): | -7.72 | |
| Chande Momentum Oscillator (20): | 0.3087 | |
| Repulse (5,40,3): | 1.7717 | |
| ROCnROLL: | 1 | |
| TRIX (15,9): | 0.0216 | |
| Courbe Coppock: | 4.86 |
| MA7: | 10.1705 | |
| MA20: | 10.0371 | |
| MA50: | 10.0679 | |
| MA100: | 10.1355 | |
| MAexp7: | 10.1836 | |
| MAexp20: | 10.0918 | |
| MAexp50: | 10.0793 | |
| MAexp100: | 10.1048 | |
| Price / MA7: | +1.35% | |
| Price / MA20: | +2.69% | |
| Price / MA50: | +2.38% | |
| Price / MA100: | +1.70% | |
| Price / MAexp7: | +1.22% | |
| Price / MAexp20: | +2.14% | |
| Price / MAexp50: | +2.26% | |
| Price / MAexp100: | +2.00% |
News
The last news published on EUR/SEK at the time of the generation of this analysis was as follows:
-
 EUR/SEK To Head Higher
-
Hows does more Riksbank QE impact USD/SEK and EUR/SEK ?
-
EUR/SEK to Grind Lower
-
Danske Bank On EUR/SEK
-
Nordea on EUR/SEK
About author

Online


Add a comment
Comments
0 comments on the analysis EUR/SEK - Daily