BEACON ROOFING SUPPLY INC. - Daily - Technical analysis published on 12/02/2019 (GMT)
- Who voted?
- 218
- 0
Click here for a new analysis!
- Timeframe : Daily
- - Analysis generated on
- Status : LEVEL MAINTAINED
Summary of the analysis

Additional analysis
Quotes
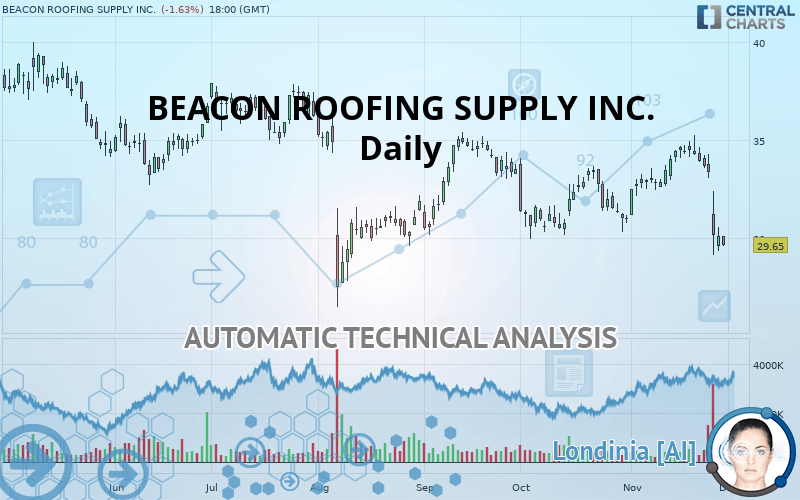
BEACON ROOFING SUPPLY INC. rating 29.65 USD. On the day, this instrument lost -1.63% and was between 29.60 USD and 30.13 USD. This implies that the price is at +0.17% from its lowest and at -1.59% from its highest.A bearish opening was detected by the Central Gaps scanner. Sellers are trying to impose a bearish trend in the very short term.
Bearish opening
Type : Bearish
Timeframe : Openning
A study of price movements over other periods shows the following variations:
Near a new LOW record (1 month)
Type : Bearish
Timeframe : Weekly
Technical
Technical analysis of BEACON ROOFING SUPPLY INC. in Daily shows a overall strongly bearish trend. The signals given by moving averages are 85.71% bearish. This strong bearish trend is confirmed by the strong signals currently being given by short-term moving averages. The Central Indicators scanner does not detect any result on moving averages that would impact this trend.
The probability of a further decline is high given the direction of the technical indicators.
Caution: the Central Indicators scanner currently detects an excess:
RSI indicator is oversold : under 30
Type : Neutral
Timeframe : Daily
CCI indicator is oversold : under -100
Type : Neutral
Timeframe : Daily
Previous candle closed under Bollinger bands
Type : Neutral
Timeframe : Daily
Williams %R indicator is oversold : under -80
Type : Neutral
Timeframe : Daily
Pivot points : price is under support 3
Type : Neutral
Timeframe : Weekly
MACD indicator is back under 0
Type : Bearish
Timeframe : Daily
Price is back over the pivot point
Type : Bullish
Timeframe : Daily
The Central Patterns scanner, which studies chart patterns, resistances and supports, has identified these signals:
Horizontal support is broken
Type : Bearish
Timeframe : Daily
Support of channel is broken
Type : Bearish
Timeframe : Daily
The Central Candlesticks scanner which studies Japanese candlesticks did not detect anything.
| S3 | S2 | S1 | Price | R1 | R2 | R3 | |
|---|---|---|---|---|---|---|---|
| ProTrendLines | 17.70 | 23.08 | 28.21 | 29.65 | 34.09 | 35.09 | 37.88 |
| Change (%) | -40.30% | -22.16% | -4.86% | - | +14.97% | +18.35% | +27.76% |
| Change | -11.95 | -6.57 | -1.44 | - | +4.44 | +5.44 | +8.23 |
| Level | Minor | Major | Major | - | Major | Major | Minor |
Pivot points can also be used to set your price objectives. Here is the price situation in relation to pivot points:
| Pivot points | S3 | S2 | S1 | PP | R1 | R2 | R3 |
|---|---|---|---|---|---|---|---|
| Standard | 28.21 | 28.78 | 29.46 | 30.03 | 30.71 | 31.28 | 31.96 |
| Camarilla | 29.80 | 29.91 | 30.03 | 30.14 | 30.26 | 30.37 | 30.48 |
| Woodie | 28.27 | 28.81 | 29.52 | 30.06 | 30.77 | 31.31 | 32.02 |
| Fibonacci | 28.78 | 29.26 | 29.55 | 30.03 | 30.51 | 30.80 | 31.28 |
| Pivot points | S3 | S2 | S1 | PP | R1 | R2 | R3 |
|---|---|---|---|---|---|---|---|
| Standard | 31.40 | 32.50 | 33.09 | 34.19 | 34.78 | 35.88 | 36.47 |
| Camarilla | 33.23 | 33.38 | 33.54 | 33.69 | 33.85 | 34.00 | 34.16 |
| Woodie | 31.16 | 32.37 | 32.85 | 34.06 | 34.54 | 35.75 | 36.23 |
| Fibonacci | 32.50 | 33.14 | 33.54 | 34.19 | 34.83 | 35.23 | 35.88 |
| Pivot points | S3 | S2 | S1 | PP | R1 | R2 | R3 |
|---|---|---|---|---|---|---|---|
| Standard | 25.14 | 27.55 | 29.29 | 31.70 | 33.44 | 35.85 | 37.59 |
| Camarilla | 29.90 | 30.28 | 30.66 | 31.04 | 31.42 | 31.80 | 32.18 |
| Woodie | 24.82 | 27.38 | 28.97 | 31.53 | 33.12 | 35.68 | 37.27 |
| Fibonacci | 27.55 | 29.13 | 30.11 | 31.70 | 33.28 | 34.26 | 35.85 |
Numerical data
The following are the details of the technical indicators and moving averages that were collected to generate this technical analysis:
| RSI (14): | 26.93 | |
| MACD (12,26,9): | -0.3600 | |
| Directional Movement: | -19.77 | |
| AROON (14): | -28.57 | |
| DEMA (21): | 32.29 | |
| Parabolic SAR (0,02-0,02-0,2): | 34.76 | |
| Elder Ray (13): | -2.44 | |
| Super Trend (3,10): | 33.22 | |
| Zig ZAG (10): | 29.65 | |
| VORTEX (21): | 0.9700 | |
| Stochastique (14,3,5): | 13.36 | |
| TEMA (21): | 31.81 | |
| Williams %R (14): | -92.00 | |
| Chande Momentum Oscillator (20): | -3.82 | |
| Repulse (5,40,3): | -4.3200 | |
| ROCnROLL: | 2 | |
| TRIX (15,9): | 0.1000 | |
| Courbe Coppock: | 5.06 |
| MA7: | 32.20 | |
| MA20: | 33.03 | |
| MA50: | 32.50 | |
| MA100: | 32.94 | |
| MAexp7: | 31.58 | |
| MAexp20: | 32.53 | |
| MAexp50: | 32.68 | |
| MAexp100: | 33.09 | |
| Price / MA7: | -7.92% | |
| Price / MA20: | -10.23% | |
| Price / MA50: | -8.77% | |
| Price / MA100: | -9.99% | |
| Price / MAexp7: | -6.11% | |
| Price / MAexp20: | -8.85% | |
| Price / MAexp50: | -9.27% | |
| Price / MAexp100: | -10.40% |
News
The latest news and videos published on BEACON ROOFING SUPPLY INC. at the time of the analysis were as follows:
- Beacon Roofing Supply Announces Beacon of Hope Contest Finalists
- Beacon Roofing Supply Announces Pricing of $300 Million Senior Secured Notes Offering
- Beacon Roofing Supply Announces $300 Million Senior Secured Notes Offering
- Beacon Roofing Supply Appoints Thomas D. Schmitz as Chief Accounting Officer
- Beacon Roofing Supply Provides Fiscal 2019 Second-Quarter Estimate Reflecting Unfavorable Weather Impact; Full-Year 2019 Adjusted EPS Expected to Meet Lower End of Guidance Range
About author

Online


Add a comment
Comments
0 comments on the analysis BEACON ROOFING SUPPLY INC. - Daily