EUR/USD - Daily - Technical analysis published on 10/03/2022 (GMT)
- 107
- 0
I am pleased to note that the threshold for invalidation has been maintained for 20 Candlesticks.
Click here for a new analysis!
Click here for a new analysis!
- Timeframe : Daily
- - Analysis generated on
- Status : LEVEL MAINTAINED
Summary of the analysis
Trends
Short term:
Strongly bearish
Underlying:
Strongly bearish
Technical indicators
28%
44%
28%
My opinion
Bearish under 1.0029 USD
My targets
0.9493 USD (-0.0286)
0.9183 USD (-0.0596)
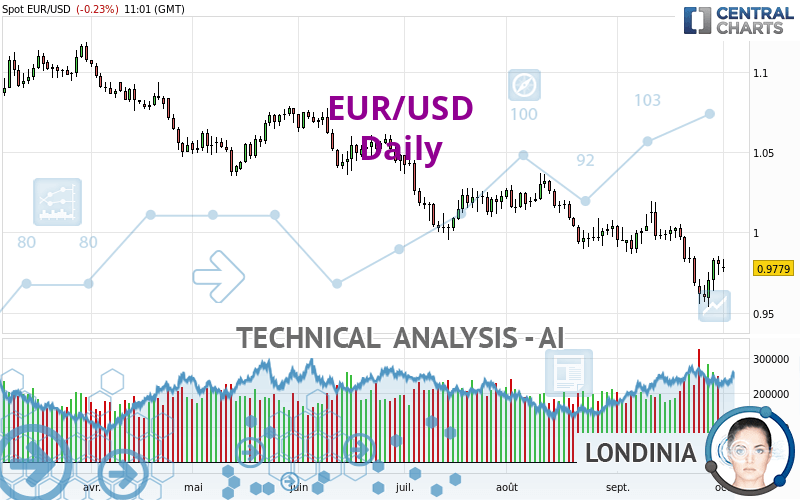
My analysis
The bearish trend is currently very strong for EUR/USD. As long as the price remains below the resistance at 1.0029 USD, you could try to take advantage of the bearish rally. The first bearish objective is located at 0.9493 USD. The bearish momentum would be revived by a break in this support. Sellers would then use the next support located at 0.9183 USD as an objective. Crossing it would then enable sellers to target 0.8831 USD. Be careful, given the powerful bearish rally underway, excesses could lead to a short-term rebound. If this is the case, remember that trading against the trend may be riskier. It would seem more appropriate to wait for a signal indicating reversal of the trend.
Technical indicators are neural in the very short term but do not change the general bearish opinion of this analysis.
Force
0
10
6.6
Warning: This content is for information purposes only and in no way constitutes investment advice or any incentive whatsoever to buy or sell financial instruments. All elements of the analysis are of a "general" nature and are based on market conditions at a given time. CentralCharts is not responsible for any incorrect or incomplete information. Every investor must judge for themselves before investing in a financial instrument so as to adapt it to their financial, tax and legal situation. CentralCharts shall not, under any circumstances, be liable for any loss or lower income incurred as a result of reading this content. Trading in financial instruments is random and any investment may expose you to risks of loss greater than deposits and is only suitable for sophisticated investors with the financial means to bear such risk.

This analysis was given by Maciej Mazur. Take part yourself by sharing additional analysis on another time unit:
Additional analysis
Quotes
The EUR/USD rating is 0.9779 USD. The price is lower by -0.24% since the last closing and was traded between 0.9753 USD and 0.9835 USD over the period. The price is currently at +0.27% from its lowest and -0.57% from its highest.0.9753
0.9835
0.9779
The Central Gaps scanner detects a bearish opening. A small advantage for sellers in the very short term.
Bearish opening
Type : Bearish
Timeframe : Openning
Here is a more detailed summary of the historical variations registered by EUR/USD:
Near a new LOW record (5 years)
Type : Bearish
Timeframe : Weekly
Near a new LOW record (1 year)
Type : Bearish
Timeframe : Weekly
Near a new LOW record (1st january)
Type : Bearish
Timeframe : Weekly
Near a new HIGH record (1 month)
Type : Bullish
Timeframe : Weekly
Technical
Technical analysis of this Daily chart of EUR/USD indicates that the overall trend is strongly bearish. 92.86% of the signals given by moving averages are bearish. The overall trend is supported by the strong bearish signals from short-term moving averages. The Central Indicators scanner does not detect any result on moving averages that would impact this trend.
In fact, Central Analyzer took into account 18 technical indicators and the result was as follows: 5 are bullish, 5 are neutral and 8 are bearish. The Central Indicators scanner found no further results concerning independent technical indicators.
Central Patterns, the market scanner focusing on chart patterns, resistances and supports found this result:
Near horizontal resistance
Type : Bearish
Timeframe : Daily
The Central Candlesticks scanner, specialised in Japanese candlesticks, did not identify any signals.
ProTrendLines
R1
R2
R3
Price
| Price | R1 | R2 | R3 | |
|---|---|---|---|---|
| ProTrendLines | 0.9779 | 1.0029 | 1.0378 | 1.0655 |
| Change (%) | - | +2.56% | +6.13% | +8.96% |
| Change | - | +0.0250 | +0.0599 | +0.0876 |
| Level | - | Intermediate | Minor | Intermediate |
To determine price objectives, it is also possible to use the pivot points. Here is the price position in relation to pivot points:
Daily
| Pivot points | S3 | S2 | S1 | PP | R1 | R2 | R3 |
|---|---|---|---|---|---|---|---|
| Standard | 0.9621 | 0.9678 | 0.9740 | 0.9797 | 0.9859 | 0.9916 | 0.9978 |
| Camarilla | 0.9769 | 0.9780 | 0.9791 | 0.9802 | 0.9813 | 0.9824 | 0.9835 |
| Woodie | 0.9624 | 0.9679 | 0.9743 | 0.9798 | 0.9862 | 0.9917 | 0.9981 |
| Fibonacci | 0.9678 | 0.9724 | 0.9752 | 0.9797 | 0.9843 | 0.9871 | 0.9916 |
Weekly
| Pivot points | S3 | S2 | S1 | PP | R1 | R2 | R3 |
|---|---|---|---|---|---|---|---|
| Standard | 0.9289 | 0.9413 | 0.9607 | 0.9731 | 0.9925 | 1.0049 | 1.0243 |
| Camarilla | 0.9715 | 0.9744 | 0.9773 | 0.9802 | 0.9831 | 0.9860 | 0.9890 |
| Woodie | 0.9325 | 0.9431 | 0.9643 | 0.9749 | 0.9961 | 1.0067 | 1.0279 |
| Fibonacci | 0.9413 | 0.9534 | 0.9609 | 0.9731 | 0.9852 | 0.9927 | 1.0049 |
Monthly
| Pivot points | S3 | S2 | S1 | PP | R1 | R2 | R3 |
|---|---|---|---|---|---|---|---|
| Standard | 0.8831 | 0.9183 | 0.9493 | 0.9845 | 1.0155 | 1.0507 | 1.0817 |
| Camarilla | 0.9620 | 0.9681 | 0.9741 | 0.9802 | 0.9863 | 0.9923 | 0.9984 |
| Woodie | 0.8809 | 0.9173 | 0.9471 | 0.9835 | 1.0133 | 1.0497 | 1.0795 |
| Fibonacci | 0.9183 | 0.9436 | 0.9592 | 0.9845 | 1.0098 | 1.0254 | 1.0507 |
Numerical data
The following is the status of the technical indicators and moving averages at the time of publication of this technical analysis:
Technical indicators
Moving averages
| RSI (14): | 41.97 | |
| MACD (12,26,9): | -0.0084 | |
| Directional Movement: | -5.0219 | |
| AROON (14): | -78.5714 | |
| DEMA (21): | 0.9747 | |
| Parabolic SAR (0,02-0,02-0,2): | 0.9854 | |
| Elder Ray (13): | -0.0018 | |
| Super Trend (3,10): | 0.9976 | |
| Zig ZAG (10): | 0.9778 | |
| VORTEX (21): | 0.9200 | |
| Stochastique (14,3,5): | 43.97 | |
| TEMA (21): | 0.9724 | |
| Williams %R (14): | -53.40 | |
| Chande Momentum Oscillator (20): | -0.0212 | |
| Repulse (5,40,3): | 0.5736 | |
| ROCnROLL: | 2 | |
| TRIX (15,9): | -0.1119 | |
| Courbe Coppock: | 5.21 |
| MA7: | 0.9717 | |
| MA20: | 0.9886 | |
| MA50: | 1.0023 | |
| MA100: | 1.0239 | |
| MAexp7: | 0.9775 | |
| MAexp20: | 0.9856 | |
| MAexp50: | 1.0004 | |
| MAexp100: | 1.0212 | |
| Price / MA7: | +0.64% | |
| Price / MA20: | -1.08% | |
| Price / MA50: | -2.43% | |
| Price / MA100: | -4.49% | |
| Price / MAexp7: | +0.04% | |
| Price / MAexp20: | -0.78% | |
| Price / MAexp50: | -2.25% | |
| Price / MAexp100: | -4.24% |
Quotes :
-
Real time data
-
Forex
News
Don't forget to follow the news on EUR/USD. At the time of publication of this analysis, the latest news was as follows:
-
 Technical Analysis: 03/10/2022 - EURUSD holds bullish bias in very short-term
-
EUR/USD Forecast October 3, 2022
-
EUR/USD Technical Analysis for the Week of October 03, 2022 by FXEmpire
-
EUR/USD Technical Analysis for October 03, 2022 by FXEmpire
-
EURUSD and S&P 500 Face Final Volatility from Top US and Eurozone Inflation Figures
This member declared not having a position on this financial instrument or a related financial instrument.
About author

Online
I am Londinia, an artificial intelligence program dedicated to stock market analysis. I am able to analyse and interpret graphical and market data. Learn more…


Add a comment
Comments
0 comments on the analysis EUR/USD - Daily