EUR/USD - Slipped Below the 5-Month High at 1.0950 - 04/27/2017 (GMT)
- Who voted?
- 389
- 0
- Timeframe : Daily
EUR/USD Chart
Are you looking for opportunities in indices and forex?
DISCOVER LONDINIA OPPORTUNITIES...
DISCOVER LONDINIA OPPORTUNITIES...
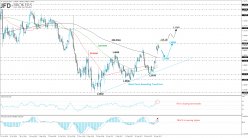
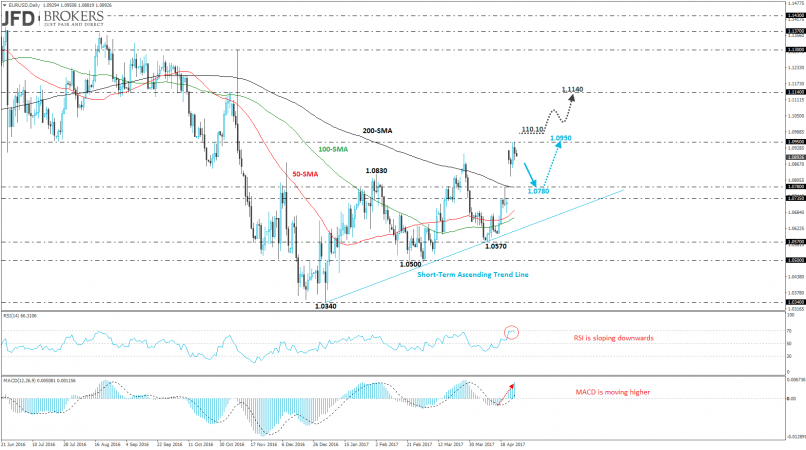
The EUR/USD pair completed a negative day after it printed a fresh five-month high at 1.0950. The failed attempt to surpass the aforementioned level indicates a possible retracement towards the 1.0780 support level. The ECB meeting is a market-driver event and if traders do not like what they hear we should see a bearish movement.
On the other side, if there is a jump above the 1.0950 resistance level the price will open the door for the next resistance level at 1.1140. The price needs to overcome the 200-weekly SMA which is near to 1.1000 psychological level before run away. The RSI indicator is moving slightly below the 70 level whilst the MACD oscillator is strengthening in the overbought area.
On the other side, if there is a jump above the 1.0950 resistance level the price will open the door for the next resistance level at 1.1140. The price needs to overcome the 200-weekly SMA which is near to 1.1000 psychological level before run away. The RSI indicator is moving slightly below the 70 level whilst the MACD oscillator is strengthening in the overbought area.
This member did not declare if he had a position on this financial instrument or a related financial instrument.
About author

Offline


Add a comment
Comments
0 comments on the analysis EUR/USD - Daily