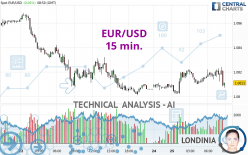
EUR/USD - 15 min. - Technical analysis published on 03/25/2024 (GMT)
- 90
- 0
- Timeframe : 15 min.
- - Analysis generated on
- Status : NEUTRAL
Summary of the analysis

Additional analysis
Quotes
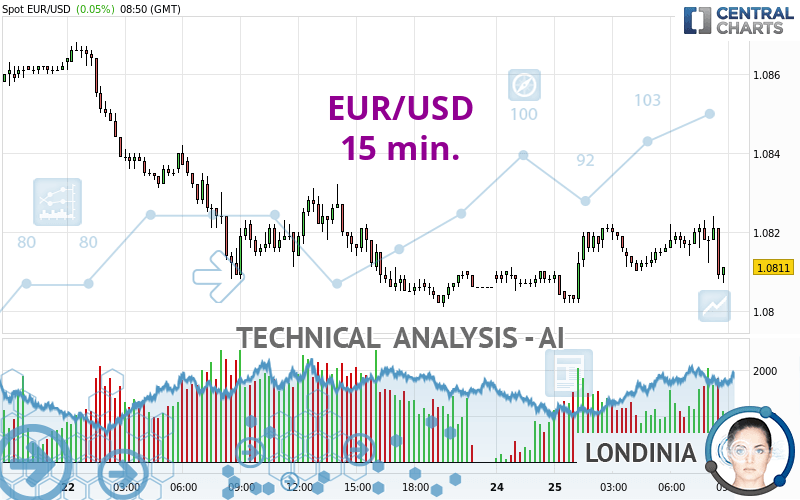
The EUR/USD rating is 1.0811 USD. On the day, this instrument gained +0.05% and was between 1.0802 USD and 1.0824 USD. This implies that the price is at +0.08% from its lowest and at -0.12% from its highest.The Central Gaps scanner detects a bullish opening. A small advantage for buyers in the very short term.
Bullish opening
Type : Bullish
Timeframe : Openning
Here is a more detailed summary of the historical variations registered by EUR/USD:
Near a new HIGH record (1 year)
Type : Bullish
Timeframe : Weekly
Near a new HIGH record (1st january)
Type : Bullish
Timeframe : Weekly
Near a new HIGH record (1 month)
Type : Bullish
Timeframe : Weekly
Technical
Technical analysis of this 15 min. chart of EUR/USD indicates that the overall trend is not clearly defined. This indecision could turn into a bearish trend due to the slightly bearish signals currently given by short-term moving averages. The Central Indicators market scanner is currently detecting several bearish signals that could impact this trend:
Bearish price crossover with Moving Average 20
Type : Bearish
Timeframe : 15 minutes
Bearish price crossover with Moving Average 50
Type : Bearish
Timeframe : 15 minutes
Bearish price crossover with Moving Average 100
Type : Bearish
Timeframe : 15 minutes
Bearish price crossover with adaptative moving average 20
Type : Bearish
Timeframe : 15 minutes
Bearish price crossover with adaptative moving average 50
Type : Bearish
Timeframe : 15 minutes
Bearish price crossover with adaptative moving average 100
Type : Bearish
Timeframe : 15 minutes
In fact, Central Analyzer took into account 18 technical indicators and the result was as follows: 5 are bullish, 4 are neutral and 9 are bearish. Caution: the Central Indicators scanner currently detects an excess:
CCI indicator is oversold : under -100
Type : Neutral
Timeframe : 15 minutes
Williams %R indicator is oversold : under -80
Type : Neutral
Timeframe : 15 minutes
RSI indicator is back under 50
Type : Bearish
Timeframe : 15 minutes
Parabolic SAR indicator bearish reversal
Type : Bearish
Timeframe : 15 minutes
Ichimoku : price is under the cloud
Type : Bearish
Timeframe : 15 minutes
SuperTrend indicator bearish reversal
Type : Bearish
Timeframe : 15 minutes
Momentum indicator is back under 0
Type : Bearish
Timeframe : 15 minutes
Central Patterns, the scanner specializing in chart patterns, did not identify any signals.
The Central Candlesticks scanner, specialised in Japanese candlesticks, did not identify any signals.
| S3 | S2 | S1 | Price | R1 | R2 | R3 | |
|---|---|---|---|---|---|---|---|
| ProTrendLines | 1.0469 | 1.0638 | 1.0708 | 1.0811 | 1.0835 | 1.0855 | 1.0873 |
| Change (%) | -3.16% | -1.60% | -0.95% | - | +0.22% | +0.41% | +0.57% |
| Change | -0.0342 | -0.0173 | -0.0103 | - | +0.0024 | +0.0044 | +0.0062 |
| Level | Intermediate | Major | Intermediate | - | Intermediate | Minor | Intermediate |
To determine price objectives, it is also possible to use the pivot points. Here is the price position in relation to pivot points:
| Pivot points | S3 | S2 | S1 | PP | R1 | R2 | R3 |
|---|---|---|---|---|---|---|---|
| Standard | 1.0715 | 1.0758 | 1.0782 | 1.0825 | 1.0849 | 1.0892 | 1.0916 |
| Camarilla | 1.0788 | 1.0794 | 1.0800 | 1.0806 | 1.0812 | 1.0818 | 1.0824 |
| Woodie | 1.0706 | 1.0753 | 1.0773 | 1.0820 | 1.0840 | 1.0887 | 1.0907 |
| Fibonacci | 1.0758 | 1.0784 | 1.0799 | 1.0825 | 1.0851 | 1.0866 | 1.0892 |
| Pivot points | S3 | S2 | S1 | PP | R1 | R2 | R3 |
|---|---|---|---|---|---|---|---|
| Standard | 1.0615 | 1.0708 | 1.0757 | 1.0850 | 1.0899 | 1.0992 | 1.1041 |
| Camarilla | 1.0767 | 1.0780 | 1.0793 | 1.0806 | 1.0819 | 1.0832 | 1.0845 |
| Woodie | 1.0593 | 1.0697 | 1.0735 | 1.0839 | 1.0877 | 1.0981 | 1.1019 |
| Fibonacci | 1.0708 | 1.0762 | 1.0796 | 1.0850 | 1.0904 | 1.0938 | 1.0992 |
| Pivot points | S3 | S2 | S1 | PP | R1 | R2 | R3 |
|---|---|---|---|---|---|---|---|
| Standard | 1.0498 | 1.0597 | 1.0701 | 1.0800 | 1.0904 | 1.1003 | 1.1107 |
| Camarilla | 1.0750 | 1.0769 | 1.0787 | 1.0806 | 1.0825 | 1.0843 | 1.0862 |
| Woodie | 1.0502 | 1.0598 | 1.0705 | 1.0801 | 1.0908 | 1.1004 | 1.1111 |
| Fibonacci | 1.0597 | 1.0674 | 1.0722 | 1.0800 | 1.0877 | 1.0925 | 1.1003 |
Numerical data
The following is the status of the technical indicators and moving averages at the time of publication of this technical analysis:
| RSI (14): | 50.83 | |
| MACD (12,26,9): | 0.0002 | |
| Directional Movement: | 7.7441 | |
| AROON (14): | 92.8571 | |
| DEMA (21): | 1.0819 | |
| Parabolic SAR (0,02-0,02-0,2): | 1.0812 | |
| Elder Ray (13): | -0.0001 | |
| Super Trend (3,10): | 1.0809 | |
| Zig ZAG (10): | 1.0812 | |
| VORTEX (21): | 0.9500 | |
| Stochastique (14,3,5): | 49.44 | |
| TEMA (21): | 1.0818 | |
| Williams %R (14): | -93.75 | |
| Chande Momentum Oscillator (20): | -0.0008 | |
| Repulse (5,40,3): | -0.1205 | |
| ROCnROLL: | 2 | |
| TRIX (15,9): | 0.0023 | |
| Courbe Coppock: | 0.04 |
| MA7: | 1.0862 | |
| MA20: | 1.0878 | |
| MA50: | 1.0841 | |
| MA100: | 1.0866 | |
| MAexp7: | 1.0814 | |
| MAexp20: | 1.0818 | |
| MAexp50: | 1.0815 | |
| MAexp100: | 1.0821 | |
| Price / MA7: | -0.47% | |
| Price / MA20: | -0.62% | |
| Price / MA50: | -0.28% | |
| Price / MA100: | -0.51% | |
| Price / MAexp7: | -0.03% | |
| Price / MAexp20: | -0.06% | |
| Price / MAexp50: | -0.04% | |
| Price / MAexp100: | -0.09% |
News
The last news published on EUR/USD at the time of the generation of this analysis was as follows:
-
 EUR/USD Forecast March 25, 2024
-
EUR/USD Long Term Forecast and Technical Analysis for March 22, 2024, by Chris Lewis for FX Empire
-
EUR/USD Daily Forecast and Technical Analysis for March 22, 2024, by Chris Lewis for FX Empire
-
EUR/USD Daily Forecast and Technical Analysis for March 21, 2024, by Chris Lewis for FX Empire
-
EUR/USD Daily Forecast and Technical Analysis for March 20, 2024, by Chris Lewis for FX Empire
About author

Online


Add a comment
Comments
0 comments on the analysis EUR/USD - 15 min.