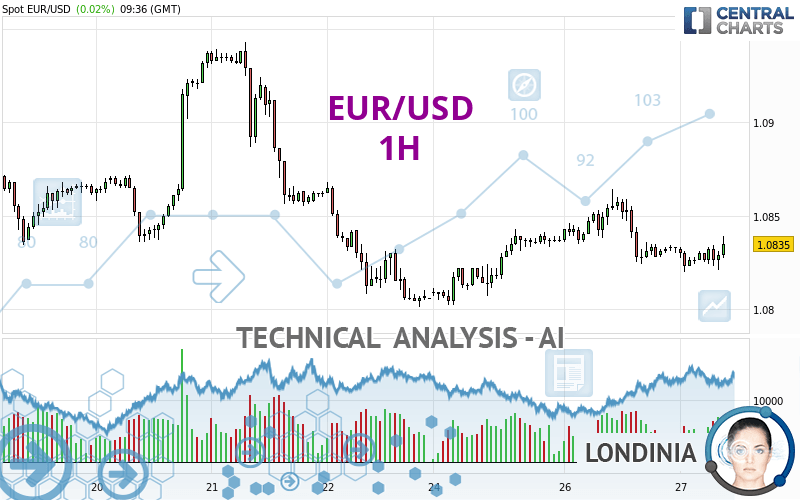
EUR/USD - 1H - Technical analysis published on 03/27/2024 (GMT)
- 98
- 0
- Timeframe : 1H
- - Analysis generated on
- Status : NEUTRAL

Summary of the analysis

Additional analysis
Quotes
EUR/USD rating 1.0835 USD. The price registered an increase of +0.02% on the session and was traded between 1.0820 USD and 1.0839 USD over the period. The price is currently at +0.14% from its lowest and -0.04% from its highest.The Central Gaps scanner detects a bearish opening marking the presence of sellers ahead of buyers at the opening but not sufficiently marked to allow the price to register a quotation gap.
Bearish opening
Type : Bearish
Timeframe : Openning
So that you have an overall view of the price change, here is a table showing the variations over several periods:
Near a new HIGH record (1 year)
Type : Bullish
Timeframe : Weekly
Near a new HIGH record (1st january)
Type : Bullish
Timeframe : Weekly
Near a new HIGH record (1 month)
Type : Bullish
Timeframe : Weekly
Technical
A technical analysis in 1H of this EUR/USD chart shows a slightly bearish trend. Only 57.14% of the signals given by moving averages are bearish. This slightly bearish trend could return to neutral given the neutral signals also given by short-term moving averages. The Central Indicators scanner detects bullish signals on moving averages that could impact this trend:
Bullish price crossover with Moving Average 20
Type : Bullish
Timeframe : 1 hour
Bullish price crossover with adaptative moving average 50
Type : Bullish
Timeframe : 1 hour
In fact, of the 18 technical indicators analysed by Central Analyzer, 9 are bullish, 5 are neutral and 4 are bearish. But beware of excesses. The Central Indicators scanner currently detects this:
Williams %R indicator is overbought : over -20
Type : Neutral
Timeframe : 1 hour
RSI indicator is back over 50
Type : Bullish
Timeframe : 1 hour
MACD crosses UP its Moving Average
Type : Bullish
Timeframe : 1 hour
Parabolic SAR indicator bullish reversal
Type : Bullish
Timeframe : 1 hour
Aroon indicator bullish trend
Type : Bullish
Timeframe : 1 hour
Ichimoku : price is over the cloud
Type : Bullish
Timeframe : 1 hour
Momentum indicator is back over 0
Type : Bullish
Timeframe : 1 hour
An analysis of the price chart with the Central Patterns scanner (detector of chart patterns and resistances and supports) shows a result that can have an impact on the price change:
Near support of channel
Type : Bullish
Timeframe : 1 hour
No result was found by the Central Candlesticks scanner on Japanese candlesticks.
| S3 | S2 | S1 | Price | R1 | R2 | R3 | |
|---|---|---|---|---|---|---|---|
| ProTrendLines | 1.0708 | 1.0801 | 1.0834 | 1.0835 | 1.0855 | 1.0906 | 1.0940 |
| Change (%) | -1.17% | -0.31% | -0.01% | - | +0.18% | +0.66% | +0.97% |
| Change | -0.0127 | -0.0034 | -0.0001 | - | +0.0020 | +0.0071 | +0.0105 |
| Level | Intermediate | Intermediate | Intermediate | - | Intermediate | Minor | Major |
To determine price objectives, it is also possible to use the pivot points. Here is the price position in relation to pivot points:
| Pivot points | S3 | S2 | S1 | PP | R1 | R2 | R3 |
|---|---|---|---|---|---|---|---|
| Standard | 1.0777 | 1.0800 | 1.0817 | 1.0840 | 1.0857 | 1.0880 | 1.0897 |
| Camarilla | 1.0822 | 1.0826 | 1.0829 | 1.0833 | 1.0837 | 1.0840 | 1.0844 |
| Woodie | 1.0773 | 1.0799 | 1.0813 | 1.0839 | 1.0853 | 1.0879 | 1.0893 |
| Fibonacci | 1.0800 | 1.0816 | 1.0825 | 1.0840 | 1.0856 | 1.0865 | 1.0880 |
| Pivot points | S3 | S2 | S1 | PP | R1 | R2 | R3 |
|---|---|---|---|---|---|---|---|
| Standard | 1.0615 | 1.0708 | 1.0757 | 1.0850 | 1.0899 | 1.0992 | 1.1041 |
| Camarilla | 1.0767 | 1.0780 | 1.0793 | 1.0806 | 1.0819 | 1.0832 | 1.0845 |
| Woodie | 1.0593 | 1.0697 | 1.0735 | 1.0839 | 1.0877 | 1.0981 | 1.1019 |
| Fibonacci | 1.0708 | 1.0762 | 1.0796 | 1.0850 | 1.0904 | 1.0938 | 1.0992 |
| Pivot points | S3 | S2 | S1 | PP | R1 | R2 | R3 |
|---|---|---|---|---|---|---|---|
| Standard | 1.0498 | 1.0597 | 1.0701 | 1.0800 | 1.0904 | 1.1003 | 1.1107 |
| Camarilla | 1.0750 | 1.0769 | 1.0787 | 1.0806 | 1.0825 | 1.0843 | 1.0862 |
| Woodie | 1.0502 | 1.0598 | 1.0705 | 1.0801 | 1.0908 | 1.1004 | 1.1111 |
| Fibonacci | 1.0597 | 1.0674 | 1.0722 | 1.0800 | 1.0877 | 1.0925 | 1.1003 |
Numerical data
The following are the details of the technical indicators and moving averages that were collected to generate this technical analysis:
| RSI (14): | 54.88 | |
| MACD (12,26,9): | -0.0002 | |
| Directional Movement: | 1.2871 | |
| AROON (14): | 57.1429 | |
| DEMA (21): | 1.0830 | |
| Parabolic SAR (0,02-0,02-0,2): | 1.0820 | |
| Elder Ray (13): | 0.0002 | |
| Super Trend (3,10): | 1.0847 | |
| Zig ZAG (10): | 1.0838 | |
| VORTEX (21): | 0.8757 | |
| Stochastique (14,3,5): | 64.91 | |
| TEMA (21): | 1.0828 | |
| Williams %R (14): | -10.53 | |
| Chande Momentum Oscillator (20): | 0.0005 | |
| Repulse (5,40,3): | 0.1246 | |
| ROCnROLL: | 1 | |
| TRIX (15,9): | -0.0035 | |
| Courbe Coppock: | 0.07 |
| MA7: | 1.0854 | |
| MA20: | 1.0878 | |
| MA50: | 1.0840 | |
| MA100: | 1.0869 | |
| MAexp7: | 1.0831 | |
| MAexp20: | 1.0832 | |
| MAexp50: | 1.0835 | |
| MAexp100: | 1.0842 | |
| Price / MA7: | -0.18% | |
| Price / MA20: | -0.40% | |
| Price / MA50: | -0.05% | |
| Price / MA100: | -0.31% | |
| Price / MAexp7: | +0.04% | |
| Price / MAexp20: | +0.03% | |
| Price / MAexp50: | -0% | |
| Price / MAexp100: | -0.06% |
News
Don't forget to follow the news on EUR/USD. At the time of publication of this analysis, the latest news was as follows:
-
 EUR/USD Forecast March 27, 2024
-
EUR/USD Daily Forecast and Technical Analysis for March 26, 2024, by Chris Lewis for FX Empire
-
EUR/USD Forecast March 26, 2024
-
EUR/USD Daily Forecast and Technical Analysis for March 25, 2024, by Chris Lewis for FX Empire
-
EUR/USD Forecast March 25, 2024
About author

Online


Add a comment
Comments
0 comments on the analysis EUR/USD - 1H