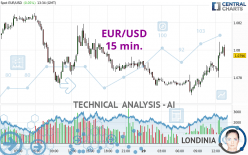
EUR/USD - 15 min. - Technical analysis published on 03/29/2024 (GMT)
- 109
- 0
Click here for a new analysis!
- Timeframe : 15 min.
- - Analysis generated on
- Status : LEVEL MAINTAINED

Summary of the analysis

Additional analysis
Quotes
The EUR/USD rating is 1.0796 USD. The price has increased by +0.05% since the last closing and was between 1.0767 USD and 1.0806 USD. This implies that the price is at +0.27% from its lowest and at -0.09% from its highest.The Central Gaps scanner detects a bullish opening. A small advantage for buyers in the very short term.
Bullish opening
Type : Bullish
Timeframe : Openning
Here is a more detailed summary of the historical variations registered by EUR/USD:
Near a new HIGH record (1 year)
Type : Bullish
Timeframe : Weekly
Near a new HIGH record (1st january)
Type : Bullish
Timeframe : Weekly
Near a new HIGH record (1 month)
Type : Bullish
Timeframe : Weekly
New LOW record (1 month)
Type : Bearish
Timeframe : Weekly
Technical
Technical analysis of EUR/USD in 15 min. shows an overall bullish trend. 78.57% of the signals given by moving averages are bullish. The overall trend is reinforced by the strong bullish signals from short-term moving averages. The Central Indicators market scanner currently does not detect any result that concerns moving averages.
In fact, 16 technical indicators on 18 studied are currently bullish. But beware of excesses. The Central Indicators scanner currently detects this:
RSI indicator is overbought : over 70
Type : Neutral
Timeframe : 15 minutes
CCI indicator is overbought : over 100
Type : Neutral
Timeframe : 15 minutes
CCI indicator: bearish divergence
Type : Bearish
Timeframe : 15 minutes
The Central Patterns scanner, which studies chart patterns, resistances and supports, has identified these signals:
Near horizontal resistance
Type : Bearish
Timeframe : 15 minutes
Resistance of channel is broken
Type : Bullish
Timeframe : 15 minutes
Central Candlesticks, the scanner specialised in Japanese candlesticks, detects this inversion signal that could impact the current short-term trend:
Doji
Type : Neutral
Timeframe : 15 minutes
| S3 | S2 | S1 | Price | R1 | R2 | R3 | |
|---|---|---|---|---|---|---|---|
| ProTrendLines | 1.0638 | 1.0708 | 1.0775 | 1.0796 | 1.0805 | 1.0835 | 1.0864 |
| Change (%) | -1.46% | -0.82% | -0.19% | - | +0.08% | +0.36% | +0.63% |
| Change | -0.0158 | -0.0088 | -0.0021 | - | +0.0009 | +0.0039 | +0.0068 |
| Level | Major | Intermediate | Intermediate | - | Intermediate | Intermediate | Minor |
To determine price objectives, it is also possible to use the pivot points. Here is the price position in relation to pivot points:
| Pivot points | S3 | S2 | S1 | PP | R1 | R2 | R3 |
|---|---|---|---|---|---|---|---|
| Standard | 1.0716 | 1.0746 | 1.0768 | 1.0798 | 1.0820 | 1.0850 | 1.0872 |
| Camarilla | 1.0777 | 1.0782 | 1.0786 | 1.0791 | 1.0796 | 1.0801 | 1.0805 |
| Woodie | 1.0713 | 1.0744 | 1.0765 | 1.0796 | 1.0817 | 1.0848 | 1.0869 |
| Fibonacci | 1.0746 | 1.0766 | 1.0778 | 1.0798 | 1.0818 | 1.0830 | 1.0850 |
| Pivot points | S3 | S2 | S1 | PP | R1 | R2 | R3 |
|---|---|---|---|---|---|---|---|
| Standard | 1.0615 | 1.0708 | 1.0757 | 1.0850 | 1.0899 | 1.0992 | 1.1041 |
| Camarilla | 1.0767 | 1.0780 | 1.0793 | 1.0806 | 1.0819 | 1.0832 | 1.0845 |
| Woodie | 1.0593 | 1.0697 | 1.0735 | 1.0839 | 1.0877 | 1.0981 | 1.1019 |
| Fibonacci | 1.0708 | 1.0762 | 1.0796 | 1.0850 | 1.0904 | 1.0938 | 1.0992 |
| Pivot points | S3 | S2 | S1 | PP | R1 | R2 | R3 |
|---|---|---|---|---|---|---|---|
| Standard | 1.0498 | 1.0597 | 1.0701 | 1.0800 | 1.0904 | 1.1003 | 1.1107 |
| Camarilla | 1.0750 | 1.0769 | 1.0787 | 1.0806 | 1.0825 | 1.0843 | 1.0862 |
| Woodie | 1.0502 | 1.0598 | 1.0705 | 1.0801 | 1.0908 | 1.1004 | 1.1111 |
| Fibonacci | 1.0597 | 1.0674 | 1.0722 | 1.0800 | 1.0877 | 1.0925 | 1.1003 |
Numerical data
The following is the status of technical indicators and moving averages registered at the time this technical analysis was created:
| RSI (14): | 72.78 | |
| MACD (12,26,9): | 0.0005 | |
| Directional Movement: | 24.2982 | |
| AROON (14): | 85.7143 | |
| DEMA (21): | 1.0792 | |
| Parabolic SAR (0,02-0,02-0,2): | 1.0783 | |
| Elder Ray (13): | 0.0010 | |
| Super Trend (3,10): | 1.0782 | |
| Zig ZAG (10): | 1.0799 | |
| VORTEX (21): | 1.2818 | |
| Stochastique (14,3,5): | 74.95 | |
| TEMA (21): | 1.0796 | |
| Williams %R (14): | -23.33 | |
| Chande Momentum Oscillator (20): | 0.0016 | |
| Repulse (5,40,3): | 0.0829 | |
| ROCnROLL: | 1 | |
| TRIX (15,9): | 0.0040 | |
| Courbe Coppock: | 0.27 |
| MA7: | 1.0820 | |
| MA20: | 1.0875 | |
| MA50: | 1.0835 | |
| MA100: | 1.0870 | |
| MAexp7: | 1.0795 | |
| MAexp20: | 1.0787 | |
| MAexp50: | 1.0784 | |
| MAexp100: | 1.0788 | |
| Price / MA7: | -0.22% | |
| Price / MA20: | -0.73% | |
| Price / MA50: | -0.36% | |
| Price / MA100: | -0.68% | |
| Price / MAexp7: | -0% | |
| Price / MAexp20: | +0.07% | |
| Price / MAexp50: | +0.10% | |
| Price / MAexp100: | +0.06% |
News
The last news published on EUR/USD at the time of the generation of this analysis was as follows:
-
 EUR/USD Forecast and Technical Analysis, March 28, 2024, by Chris Lewis #fxempire #trading #eurusd
-
EUR/USD Daily Forecast and Technical Analysis for March 28, 2024, by Chris Lewis for FX Empire
-
EUR/USD Forecast March 29, 2024
-
EUR/USD Daily Forecast and Technical Analysis for March 27, 2024, by Chris Lewis for FX Empire
-
EUR/USD Forecast March 27, 2024
About author

Online


Add a comment
Comments
0 comments on the analysis EUR/USD - 15 min.