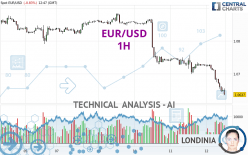
EUR/USD - 1H - Technical analysis published on 04/12/2024 (GMT)
- 80
- 0
Click here for a new analysis!
- Timeframe : 1H
- - Analysis generated on
- Status : LEVEL MAINTAINED

Summary of the analysis

Additional analysis
Quotes
The EUR/USD price is 1.0637 USD. The price registered a decrease of -0.83% on the session and was traded between 1.0635 USD and 1.0728 USD over the period. The price is currently at +0.02% from its lowest and -0.85% from its highest.So that you have an overall view of the price change, here is a table showing the variations over several periods:
Near a new LOW record (1 year)
Type : Bearish
Timeframe : Weekly
Near a new HIGH record (1st january)
Type : Bullish
Timeframe : Weekly
New LOW record (1st january)
Type : Bearish
Timeframe : Weekly
Near a new HIGH record (1 month)
Type : Bullish
Timeframe : Weekly
New LOW record (1 month)
Type : Bearish
Timeframe : Weekly
Technical
A technical analysis in 1H of this EUR/USD chart shows a sharp bearish trend. 92.86% of the signals given by moving averages are bearish. The overall trend is supported by the strong bearish signals from short-term moving averages. The Central Indicators market scanner currently does not detect any result that concerns moving averages.
In fact, 13 technical indicators on 18 studied are currently positioned bearish. But beware of excesses. The Central Indicators scanner currently detects this:
RSI indicator is oversold : under 20
Type : Neutral
Timeframe : 1 hour
CCI indicator is oversold : under -100
Type : Neutral
Timeframe : 1 hour
Williams %R indicator is oversold : under -80
Type : Neutral
Timeframe : 1 hour
Pivot points : price is under support 3
Type : Neutral
Timeframe : 1 hour
Pivot points : price is under support 3
Type : Neutral
Timeframe : Weekly
An analysis of the price chart with the Central Patterns scanner (detector of chart patterns and resistances and supports) shows several results that can have an impact on the price change:
Near horizontal support
Type : Bullish
Timeframe : 1 hour
Support of channel is broken
Type : Bearish
Timeframe : 1 hour
Central Candlesticks, the scanner specialised in Japanese candlesticks, detects this inversion signal that could impact the current short-term trend:
Doji
Type : Neutral
Timeframe : 1 hour
| S3 | S2 | S1 | Price | R1 | R2 | R3 | |
|---|---|---|---|---|---|---|---|
| ProTrendLines | 1.0129 | 1.0469 | 1.0564 | 1.0637 | 1.0638 | 1.0708 | 1.0724 |
| Change (%) | -4.78% | -1.58% | -0.69% | - | +0.01% | +0.67% | +0.82% |
| Change | -0.0508 | -0.0168 | -0.0073 | - | +0.0001 | +0.0071 | +0.0087 |
| Level | Minor | Intermediate | Minor | - | Major | Major | Minor |
Pivot points can also be used to set your price objectives. Here is the price situation in relation to pivot points:
| Pivot points | S3 | S2 | S1 | PP | R1 | R2 | R3 |
|---|---|---|---|---|---|---|---|
| Standard | 1.0640 | 1.0669 | 1.0698 | 1.0727 | 1.0756 | 1.0785 | 1.0814 |
| Camarilla | 1.0710 | 1.0715 | 1.0721 | 1.0726 | 1.0731 | 1.0737 | 1.0742 |
| Woodie | 1.0639 | 1.0669 | 1.0697 | 1.0727 | 1.0755 | 1.0785 | 1.0813 |
| Fibonacci | 1.0669 | 1.0692 | 1.0705 | 1.0727 | 1.0750 | 1.0763 | 1.0785 |
| Pivot points | S3 | S2 | S1 | PP | R1 | R2 | R3 |
|---|---|---|---|---|---|---|---|
| Standard | 1.0595 | 1.0660 | 1.0748 | 1.0813 | 1.0901 | 1.0966 | 1.1054 |
| Camarilla | 1.0795 | 1.0809 | 1.0823 | 1.0837 | 1.0851 | 1.0865 | 1.0879 |
| Woodie | 1.0608 | 1.0666 | 1.0761 | 1.0819 | 1.0914 | 1.0972 | 1.1067 |
| Fibonacci | 1.0660 | 1.0718 | 1.0754 | 1.0813 | 1.0871 | 1.0907 | 1.0966 |
| Pivot points | S3 | S2 | S1 | PP | R1 | R2 | R3 |
|---|---|---|---|---|---|---|---|
| Standard | 1.0498 | 1.0633 | 1.0712 | 1.0847 | 1.0926 | 1.1061 | 1.1140 |
| Camarilla | 1.0733 | 1.0753 | 1.0772 | 1.0792 | 1.0812 | 1.0831 | 1.0851 |
| Woodie | 1.0471 | 1.0619 | 1.0685 | 1.0833 | 1.0899 | 1.1047 | 1.1113 |
| Fibonacci | 1.0633 | 1.0714 | 1.0765 | 1.0847 | 1.0928 | 1.0979 | 1.1061 |
Numerical data
The following are the details of the technical indicators and moving averages that were collected to generate this technical analysis:
| RSI (14): | 17.57 | |
| MACD (12,26,9): | -0.0025 | |
| Directional Movement: | -38.8337 | |
| AROON (14): | -100.0000 | |
| DEMA (21): | 1.0664 | |
| Parabolic SAR (0,02-0,02-0,2): | 1.0705 | |
| Elder Ray (13): | -0.0034 | |
| Super Trend (3,10): | 1.0686 | |
| Zig ZAG (10): | 1.0637 | |
| VORTEX (21): | 0.7035 | |
| Stochastique (14,3,5): | 4.30 | |
| TEMA (21): | 1.0654 | |
| Williams %R (14): | -98.86 | |
| Chande Momentum Oscillator (20): | -0.0088 | |
| Repulse (5,40,3): | -0.3374 | |
| ROCnROLL: | 2 | |
| TRIX (15,9): | -0.0229 | |
| Courbe Coppock: | 1.16 |
| MA7: | 1.0786 | |
| MA20: | 1.0812 | |
| MA50: | 1.0823 | |
| MA100: | 1.0866 | |
| MAexp7: | 1.0662 | |
| MAexp20: | 1.0692 | |
| MAexp50: | 1.0730 | |
| MAexp100: | 1.0764 | |
| Price / MA7: | -1.38% | |
| Price / MA20: | -1.62% | |
| Price / MA50: | -1.72% | |
| Price / MA100: | -2.11% | |
| Price / MAexp7: | -0.23% | |
| Price / MAexp20: | -0.51% | |
| Price / MAexp50: | -0.87% | |
| Price / MAexp100: | -1.18% |
News
The latest news and videos published on EUR/USD at the time of the analysis were as follows:
-
 EUR/USD Daily Forecast and Technical Analysis for April 11, 2024, by Chris Lewis for FX Empire
-
EUR/USD Forecast and Technical Analysis, April 10, 2024, by Chris Lewis #fxempire #trading #eurusd
-
EUR/USD Daily Forecast and Technical Analysis for April 10, 2024, by Chris Lewis for FX Empire
-
EUR/USD Daily Forecast and Technical Analysis for April 09, 2024, by Chris Lewis for FX Empire
-
EUR/USD Daily Forecast and Technical Analysis for April 08, 2024, by Chris Lewis for FX Empire
About author

Online


Add a comment
Comments
0 comments on the analysis EUR/USD - 1H