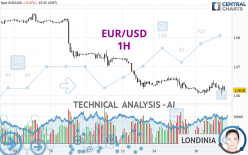
EUR/USD - 1H - Technical analysis published on 04/16/2024 (GMT)
- 92
- 0
Click here for a new analysis!
- Timeframe : 1H
- - Analysis generated on
- Status : INVALID

Summary of the analysis

Additional analysis
Quotes
The EUR/USD price is 1.0618 USD. On the day, this instrument lost -0.07% and was traded between 1.0601 USD and 1.0654 USD over the period. The price is currently at +0.16% from its lowest and -0.34% from its highest.Here is a more detailed summary of the historical variations registered by EUR/USD:
Near a new LOW record (1 year)
Type : Bearish
Timeframe : Weekly
Near a new HIGH record (1st january)
Type : Bullish
Timeframe : Weekly
New LOW record (1st january)
Type : Bearish
Timeframe : Weekly
Near a new HIGH record (1 month)
Type : Bullish
Timeframe : Weekly
New LOW record (1 month)
Type : Bearish
Timeframe : Weekly
Technical
Technical analysis of this 1H chart of EUR/USD indicates that the overall trend is strongly bearish. 89.29% of the signals given by moving averages are bearish. This strongly bearish trend is showing signs of slowing down given the slightly bearish signals given by short-term moving averages. The Central Indicators market scanner is currently detecting several bearish signals that could impact this trend:
Bearish price crossover with adaptative moving average 20
Type : Bearish
Timeframe : 1 hour
Bearish price crossover with adaptative moving average 50
Type : Bearish
Timeframe : 1 hour
Bearish price crossover with adaptative moving average 100
Type : Bearish
Timeframe : 1 hour
In fact, Central Analyzer took into account 18 technical indicators and the result was as follows: 4 are bullish, 7 are neutral and 7 are bearish. Central Indicators, the scanner specialised in technical indicators, has identified these signals:
RSI indicator is back under 50
Type : Bearish
Timeframe : 1 hour
Williams %R indicator is back under -50
Type : Bearish
Timeframe : 1 hour
The analysis of the price chart with Central Patterns scanners does not return any result.
The Central Candlesticks scanner which studies Japanese candlesticks did not detect anything.
| S3 | S2 | S1 | Price | R1 | R2 | R3 | |
|---|---|---|---|---|---|---|---|
| ProTrendLines | 1.0129 | 1.0469 | 1.0564 | 1.0618 | 1.0638 | 1.0665 | 1.0708 |
| Change (%) | -4.61% | -1.40% | -0.51% | - | +0.19% | +0.44% | +0.85% |
| Change | -0.0489 | -0.0149 | -0.0054 | - | +0.0020 | +0.0047 | +0.0090 |
| Level | Minor | Major | Minor | - | Major | Intermediate | Intermediate |
Attention could also be paid to pivot points to set price objectives:
| Pivot points | S3 | S2 | S1 | PP | R1 | R2 | R3 |
|---|---|---|---|---|---|---|---|
| Standard | 1.0563 | 1.0592 | 1.0608 | 1.0637 | 1.0653 | 1.0682 | 1.0698 |
| Camarilla | 1.0613 | 1.0617 | 1.0621 | 1.0625 | 1.0629 | 1.0633 | 1.0637 |
| Woodie | 1.0558 | 1.0589 | 1.0603 | 1.0634 | 1.0648 | 1.0679 | 1.0693 |
| Fibonacci | 1.0592 | 1.0609 | 1.0620 | 1.0637 | 1.0654 | 1.0665 | 1.0682 |
| Pivot points | S3 | S2 | S1 | PP | R1 | R2 | R3 |
|---|---|---|---|---|---|---|---|
| Standard | 1.0285 | 1.0454 | 1.0548 | 1.0717 | 1.0811 | 1.0980 | 1.1074 |
| Camarilla | 1.0571 | 1.0595 | 1.0619 | 1.0643 | 1.0667 | 1.0691 | 1.0715 |
| Woodie | 1.0249 | 1.0435 | 1.0512 | 1.0698 | 1.0775 | 1.0961 | 1.1038 |
| Fibonacci | 1.0454 | 1.0554 | 1.0616 | 1.0717 | 1.0817 | 1.0879 | 1.0980 |
| Pivot points | S3 | S2 | S1 | PP | R1 | R2 | R3 |
|---|---|---|---|---|---|---|---|
| Standard | 1.0498 | 1.0633 | 1.0712 | 1.0847 | 1.0926 | 1.1061 | 1.1140 |
| Camarilla | 1.0733 | 1.0753 | 1.0772 | 1.0792 | 1.0812 | 1.0831 | 1.0851 |
| Woodie | 1.0471 | 1.0619 | 1.0685 | 1.0833 | 1.0899 | 1.1047 | 1.1113 |
| Fibonacci | 1.0633 | 1.0714 | 1.0765 | 1.0847 | 1.0928 | 1.0979 | 1.1061 |
Numerical data
The following is the status of technical indicators and moving averages registered at the time this technical analysis was created:
| RSI (14): | 47.39 | |
| MACD (12,26,9): | -0.0002 | |
| Directional Movement: | -4.3720 | |
| AROON (14): | -35.7143 | |
| DEMA (21): | 1.0624 | |
| Parabolic SAR (0,02-0,02-0,2): | 1.0649 | |
| Elder Ray (13): | 0.0001 | |
| Super Trend (3,10): | 1.0606 | |
| Zig ZAG (10): | 1.0625 | |
| VORTEX (21): | 0.9965 | |
| Stochastique (14,3,5): | 46.54 | |
| TEMA (21): | 1.0629 | |
| Williams %R (14): | -52.83 | |
| Chande Momentum Oscillator (20): | 0.0008 | |
| Repulse (5,40,3): | 0.0542 | |
| ROCnROLL: | 2 | |
| TRIX (15,9): | -0.0040 | |
| Courbe Coppock: | 0.24 |
| MA7: | 1.0726 | |
| MA20: | 1.0788 | |
| MA50: | 1.0818 | |
| MA100: | 1.0860 | |
| MAexp7: | 1.0627 | |
| MAexp20: | 1.0627 | |
| MAexp50: | 1.0641 | |
| MAexp100: | 1.0675 | |
| Price / MA7: | -1.01% | |
| Price / MA20: | -1.58% | |
| Price / MA50: | -1.85% | |
| Price / MA100: | -2.23% | |
| Price / MAexp7: | -0.08% | |
| Price / MAexp20: | -0.08% | |
| Price / MAexp50: | -0.22% | |
| Price / MAexp100: | -0.53% |
News
The last news published on EUR/USD at the time of the generation of this analysis was as follows:
-
 EUR/USD Daily Forecast and Technical Analysis for April 16, 2024, by Chris Lewis for FX Empire
-
EUR/USD Daily Forecast and Technical Analysis for April 15, 2024, by Chris Lewis for FX Empire
-
EUR/USD Long Term Forecast and Technical Analysis for April 12, 2024, by Chris Lewis for FX Empire
-
EUR/USD Daily Forecast and Technical Analysis for April 12, 2024, by Chris Lewis for FX Empire
-
EUR/USD Daily Forecast and Technical Analysis for April 11, 2024, by Chris Lewis for FX Empire
About author

Online


Add a comment
Comments
0 comments on the analysis EUR/USD - 1H