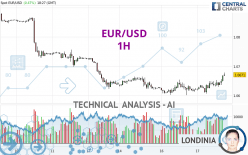
EUR/USD - 1H - Technical analysis published on 04/17/2024 (GMT)
- 84
- 0
Click here for a new analysis!
- Timeframe : 1H
- - Analysis generated on
- Status : LEVEL MAINTAINED

Summary of the analysis

Additional analysis
Quotes
The EUR/USD price is 1.0671 USD. The price has increased by +0.47% since the last closing with the lowest point at 1.0606 USD and the highest point at 1.0678 USD. The deviation from the price is +0.61% for the low point and -0.07% for the high point.Here is a more detailed summary of the historical variations registered by EUR/USD:
Near a new LOW record (1 year)
Type : Bearish
Timeframe : Weekly
Near a new HIGH record (1st january)
Type : Bullish
Timeframe : Weekly
Near a new HIGH record (1 month)
Type : Bullish
Timeframe : Weekly
Technical
Technical analysis of this 1H chart of EUR/USD indicates that the overall trend is bullish. 67.86% of the signals given by moving averages are bullish. This bullish trend is supported by the strong bullish signals given by short-term moving averages. An assessment of moving averages reveals a bullish signal that could impact this trend:
Bullish trend reversal : adaptative moving average 100
Type : Bullish
Timeframe : 1 hour
The probability of a further increase is high given the direction of the technical indicators.
Caution: the Central Indicators scanner currently detects an excess:
CCI indicator is overbought : over 100
Type : Neutral
Timeframe : 1 hour
Previous candle closed over Bollinger bands
Type : Neutral
Timeframe : 1 hour
Williams %R indicator is overbought : over -20
Type : Neutral
Timeframe : 1 hour
Pivot points : price is over resistance 1
Type : Neutral
Timeframe : 1 hour
Central Patterns, the market scanner focusing on chart patterns, resistances and supports found these results:
Near horizontal resistance
Type : Bearish
Timeframe : 1 hour
Resistance of channel is broken
Type : Bullish
Timeframe : 1 hour
The Central Candlesticks scanner, specialised in Japanese candlesticks, did not identify any signals.
| S3 | S2 | S1 | Price | R1 | R2 | R3 | |
|---|---|---|---|---|---|---|---|
| ProTrendLines | 1.0602 | 1.0638 | 1.0665 | 1.0671 | 1.0708 | 1.0803 | 1.0848 |
| Change (%) | -0.65% | -0.31% | -0.06% | - | +0.35% | +1.24% | +1.66% |
| Change | -0.0069 | -0.0033 | -0.0006 | - | +0.0037 | +0.0132 | +0.0177 |
| Level | Intermediate | Major | Intermediate | - | Intermediate | Intermediate | Major |
Pivot points can also be used to set your price objectives. Here is the price situation in relation to pivot points:
| Pivot points | S3 | S2 | S1 | PP | R1 | R2 | R3 |
|---|---|---|---|---|---|---|---|
| Standard | 1.0544 | 1.0572 | 1.0597 | 1.0625 | 1.0650 | 1.0678 | 1.0703 |
| Camarilla | 1.0606 | 1.0611 | 1.0616 | 1.0621 | 1.0626 | 1.0631 | 1.0636 |
| Woodie | 1.0542 | 1.0571 | 1.0595 | 1.0624 | 1.0648 | 1.0677 | 1.0701 |
| Fibonacci | 1.0572 | 1.0593 | 1.0605 | 1.0625 | 1.0646 | 1.0658 | 1.0678 |
| Pivot points | S3 | S2 | S1 | PP | R1 | R2 | R3 |
|---|---|---|---|---|---|---|---|
| Standard | 1.0285 | 1.0454 | 1.0548 | 1.0717 | 1.0811 | 1.0980 | 1.1074 |
| Camarilla | 1.0571 | 1.0595 | 1.0619 | 1.0643 | 1.0667 | 1.0691 | 1.0715 |
| Woodie | 1.0249 | 1.0435 | 1.0512 | 1.0698 | 1.0775 | 1.0961 | 1.1038 |
| Fibonacci | 1.0454 | 1.0554 | 1.0616 | 1.0717 | 1.0817 | 1.0879 | 1.0980 |
| Pivot points | S3 | S2 | S1 | PP | R1 | R2 | R3 |
|---|---|---|---|---|---|---|---|
| Standard | 1.0498 | 1.0633 | 1.0712 | 1.0847 | 1.0926 | 1.1061 | 1.1140 |
| Camarilla | 1.0733 | 1.0753 | 1.0772 | 1.0792 | 1.0812 | 1.0831 | 1.0851 |
| Woodie | 1.0471 | 1.0619 | 1.0685 | 1.0833 | 1.0899 | 1.1047 | 1.1113 |
| Fibonacci | 1.0633 | 1.0714 | 1.0765 | 1.0847 | 1.0928 | 1.0979 | 1.1061 |
Numerical data
The following are the details of the technical indicators and moving averages that were collected to generate this technical analysis:
| RSI (14): | 68.09 | |
| MACD (12,26,9): | 0.0008 | |
| Directional Movement: | 18.4053 | |
| AROON (14): | 85.7143 | |
| DEMA (21): | 1.0650 | |
| Parabolic SAR (0,02-0,02-0,2): | 1.0626 | |
| Elder Ray (13): | 0.0027 | |
| Super Trend (3,10): | 1.0628 | |
| Zig ZAG (10): | 1.0673 | |
| VORTEX (21): | 1.1847 | |
| Stochastique (14,3,5): | 92.23 | |
| TEMA (21): | 1.0658 | |
| Williams %R (14): | -9.72 | |
| Chande Momentum Oscillator (20): | 0.0036 | |
| Repulse (5,40,3): | 0.2041 | |
| ROCnROLL: | 1 | |
| TRIX (15,9): | 0.0060 | |
| Courbe Coppock: | 0.49 |
| MA7: | 1.0698 | |
| MA20: | 1.0775 | |
| MA50: | 1.0816 | |
| MA100: | 1.0857 | |
| MAexp7: | 1.0654 | |
| MAexp20: | 1.0641 | |
| MAexp50: | 1.0639 | |
| MAexp100: | 1.0661 | |
| Price / MA7: | -0.25% | |
| Price / MA20: | -0.97% | |
| Price / MA50: | -1.34% | |
| Price / MA100: | -1.71% | |
| Price / MAexp7: | +0.16% | |
| Price / MAexp20: | +0.28% | |
| Price / MAexp50: | +0.30% | |
| Price / MAexp100: | +0.09% |
News
The latest news and videos published on EUR/USD at the time of the analysis were as follows:
-
 EUR/USD Daily Forecast and Technical Analysis for April 17, 2024, by Chris Lewis for FX Empire
-
EUR/USD Daily Forecast and Technical Analysis for April 16, 2024, by Chris Lewis for FX Empire
-
EUR/USD Daily Forecast and Technical Analysis for April 15, 2024, by Chris Lewis for FX Empire
-
EUR/USD Long Term Forecast and Technical Analysis for April 12, 2024, by Chris Lewis for FX Empire
-
EUR/USD Daily Forecast and Technical Analysis for April 12, 2024, by Chris Lewis for FX Empire
About author

Online


Add a comment
Comments
0 comments on the analysis EUR/USD - 1H