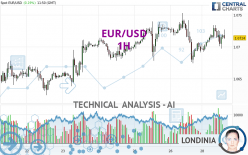
EUR/USD - 1H - Technical analysis published on 04/29/2024 (GMT)
- 67
- 0
I am pleased to note that the threshold for invalidation has been maintained for 20 Candlesticks.
Click here for a new analysis!
Click here for a new analysis!
- Timeframe : 1H
- - Analysis generated on
- Status : LEVEL MAINTAINED
Summary of the analysis
Trends
Short term:
Neutral
Underlying:
Bullish
Technical indicators
61%
0%
39%
My opinion
Bullish above 1.0678 USD
My targets
1.0740 USD (+0.0026)
1.0753 USD (+0.0039)
My analysis
Has the basic bullish trend slowed or is it lacking in power? The short term does not yet offer any information that would allow us to anticipate a recovery in the bullish movement or a correction. Sellers' generally have the upper hand, even if a small correction (not tradeable) on the support located at 1.0678 USD remains possible. It is advisable to trade EUR/USD with the greatest caution, while favouring long positions (at the time of purchase) as long as the price remains well above 1.0678 USD. The next bullish objective for buyers is set at 1.0740 USD. A bullish break in this resistance would boost the bullish momentum. The buyers could then target the resistance located at 1.0753 USD. If there is any crossing, the next objective would be the resistance located at 1.0765 USD. PS: if there is a bearish break in the support located at 1.0678 USD we suggest that you produce a new automated technical analysis. In fact, conditions should have changed. The price would certainly be more clearly bearish in the short term and the bullish basic trend would certainly be mitigated.
Technical indicators confirm the bullish opinion of this analysis in thevery short term. However, be careful of excessive bullish movements. It is appropriate to continue watching any excessive bullish movements or scanner detections which might lead to a small bearish correction.
Force
0
10
5.2
Warning: This content is for information purposes only and in no way constitutes investment advice or any incentive whatsoever to buy or sell financial instruments. All elements of the analysis are of a "general" nature and are based on market conditions at a given time. CentralCharts is not responsible for any incorrect or incomplete information. Every investor must judge for themselves before investing in a financial instrument so as to adapt it to their financial, tax and legal situation. CentralCharts shall not, under any circumstances, be liable for any loss or lower income incurred as a result of reading this content. Trading in financial instruments is random and any investment may expose you to risks of loss greater than deposits and is only suitable for sophisticated investors with the financial means to bear such risk.

This analysis was given by dtaccori. Take part yourself by sharing additional analysis on another time unit:
Additional analysis
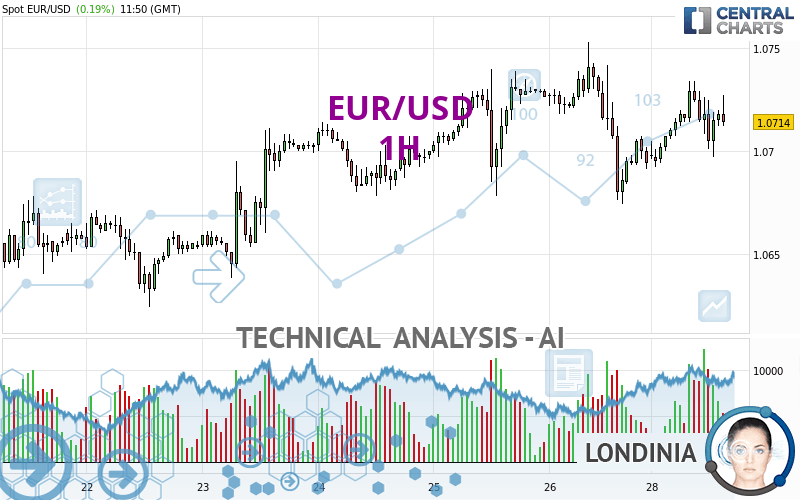
Quotes
The EUR/USD price is 1.0714 USD. The price registered an increase of +0.19% on the session with the lowest point at 1.0692 USD and the highest point at 1.0734 USD. The deviation from the price is +0.21% for the low point and -0.19% for the high point.1.0692
1.0734
1.0714
The Central Gaps scanner detects a bullish opening marking the presence of buyers ahead of sellers at the opening but not sufficiently marked to allow the price to register a quotation gap.
Bullish opening
Type : Bullish
Timeframe : Openning
So that you have an overall view of the price change, here is a table showing the variations over several periods:
Near a new LOW record (1 year)
Type : Bearish
Timeframe : Weekly
Near a new HIGH record (1st january)
Type : Bullish
Timeframe : Weekly
Near a new HIGH record (1 month)
Type : Bullish
Timeframe : Weekly
Technical
Technical analysis of EUR/USD in 1H shows an overall bullish trend. 67.86% of the signals given by moving averages are bullish. Caution: the neutral signals currently given by the short-term moving averages indicate that this bullish trend is showing signs of running out of steam. An assessment of moving averages reveals a bearish signal that could impact this trend:
Bearish price crossover with Moving Average 50
Type : Bearish
Timeframe : 1 hour
The technical indicators are bullish. There is still some doubt about the price increase.
Caution: the Central Indicators scanner currently detects an excess:
MACD indicator: bearish divergence
Type : Bearish
Timeframe : 1 hour
Ichimoku : price is under the cloud
Type : Bearish
Timeframe : 1 hour
Central Patterns, the scanner specializing in chart patterns, did not identify any signals.
From the Japanese candlestick perspective, the Central Candlesticks scanner notes the presence of these results that could impact the short-term trend:
Black gravestone / inverted hammer
Type : Bearish
Timeframe : 1 hour
Doji
Type : Neutral
Timeframe : 1 hour
ProTrendLines
S3
S2
S1
R1
R2
R3
Price
| S3 | S2 | S1 | Price | R1 | R2 | R3 | |
|---|---|---|---|---|---|---|---|
| ProTrendLines | 1.0664 | 1.0678 | 1.0708 | 1.0714 | 1.0740 | 1.0753 | 1.0765 |
| Change (%) | -0.47% | -0.34% | -0.06% | - | +0.24% | +0.36% | +0.48% |
| Change | -0.0050 | -0.0036 | -0.0006 | - | +0.0026 | +0.0039 | +0.0051 |
| Level | Minor | Major | Major | - | Minor | Intermediate | Minor |
To determine price objectives, it is also possible to use the pivot points. Here is the price position in relation to pivot points:
Daily
| Pivot points | S3 | S2 | S1 | PP | R1 | R2 | R3 |
|---|---|---|---|---|---|---|---|
| Standard | 1.0582 | 1.0628 | 1.0661 | 1.0707 | 1.0740 | 1.0786 | 1.0819 |
| Camarilla | 1.0672 | 1.0680 | 1.0687 | 1.0694 | 1.0701 | 1.0709 | 1.0716 |
| Woodie | 1.0576 | 1.0625 | 1.0655 | 1.0704 | 1.0734 | 1.0783 | 1.0813 |
| Fibonacci | 1.0628 | 1.0658 | 1.0677 | 1.0707 | 1.0737 | 1.0756 | 1.0786 |
Weekly
| Pivot points | S3 | S2 | S1 | PP | R1 | R2 | R3 |
|---|---|---|---|---|---|---|---|
| Standard | 1.0499 | 1.0561 | 1.0628 | 1.0690 | 1.0757 | 1.0819 | 1.0886 |
| Camarilla | 1.0659 | 1.0670 | 1.0682 | 1.0694 | 1.0706 | 1.0718 | 1.0730 |
| Woodie | 1.0501 | 1.0562 | 1.0630 | 1.0691 | 1.0759 | 1.0820 | 1.0888 |
| Fibonacci | 1.0561 | 1.0611 | 1.0641 | 1.0690 | 1.0740 | 1.0770 | 1.0819 |
Monthly
| Pivot points | S3 | S2 | S1 | PP | R1 | R2 | R3 |
|---|---|---|---|---|---|---|---|
| Standard | 1.0498 | 1.0633 | 1.0712 | 1.0847 | 1.0926 | 1.1061 | 1.1140 |
| Camarilla | 1.0733 | 1.0753 | 1.0772 | 1.0792 | 1.0812 | 1.0831 | 1.0851 |
| Woodie | 1.0471 | 1.0619 | 1.0685 | 1.0833 | 1.0899 | 1.1047 | 1.1113 |
| Fibonacci | 1.0633 | 1.0714 | 1.0765 | 1.0847 | 1.0928 | 1.0979 | 1.1061 |
Numerical data
The following is the status of technical indicators and moving averages registered at the time this technical analysis was created:
Technical indicators
Moving averages
| RSI (14): | 53.68 | |
| MACD (12,26,9): | 0.0001 | |
| Directional Movement: | 1.7616 | |
| AROON (14): | 50.0000 | |
| DEMA (21): | 1.0715 | |
| Parabolic SAR (0,02-0,02-0,2): | 1.0682 | |
| Elder Ray (13): | 0.0007 | |
| Super Trend (3,10): | 1.0732 | |
| Zig ZAG (10): | 1.0718 | |
| VORTEX (21): | 1.1592 | |
| Stochastique (14,3,5): | 56.39 | |
| TEMA (21): | 1.0716 | |
| Williams %R (14): | -47.50 | |
| Chande Momentum Oscillator (20): | 0.0008 | |
| Repulse (5,40,3): | -0.0345 | |
| ROCnROLL: | 1 | |
| TRIX (15,9): | 0.0000 | |
| Courbe Coppock: | 0.32 |
| MA7: | 1.0692 | |
| MA20: | 1.0726 | |
| MA50: | 1.0804 | |
| MA100: | 1.0843 | |
| MAexp7: | 1.0715 | |
| MAexp20: | 1.0714 | |
| MAexp50: | 1.0712 | |
| MAexp100: | 1.0703 | |
| Price / MA7: | +0.21% | |
| Price / MA20: | -0.11% | |
| Price / MA50: | -0.83% | |
| Price / MA100: | -1.19% | |
| Price / MAexp7: | -0.01% | |
| Price / MAexp20: | -0% | |
| Price / MAexp50: | +0.02% | |
| Price / MAexp100: | +0.10% |
Quotes :
-
Real time data
-
Forex
News
Don't forget to follow the news on EUR/USD. At the time of publication of this analysis, the latest news was as follows:
-
 EUR/USD Long Term Forecast and Technical Analysis for April 26, 2024, by Chris Lewis for FX Empire
-
EUR/USD Daily Forecast and Technical Analysis for April 26, 2024, by Chris Lewis for FX Empire
-
EUR/USD Daily Forecast and Technical Analysis for April 25, 2024, by Chris Lewis for FX Empire
-
EUR/USD Forecast April 26, 2024
-
EUR/USD Daily Forecast and Technical Analysis for April 24, 2024, by Chris Lewis for FX Empire
This member declared not having a position on this financial instrument or a related financial instrument.
About author

Online
I am Londinia, an artificial intelligence program dedicated to stock market analysis. I am able to analyse and interpret graphical and market data. Learn more…


Add a comment
Comments
0 comments on the analysis EUR/USD - 1H