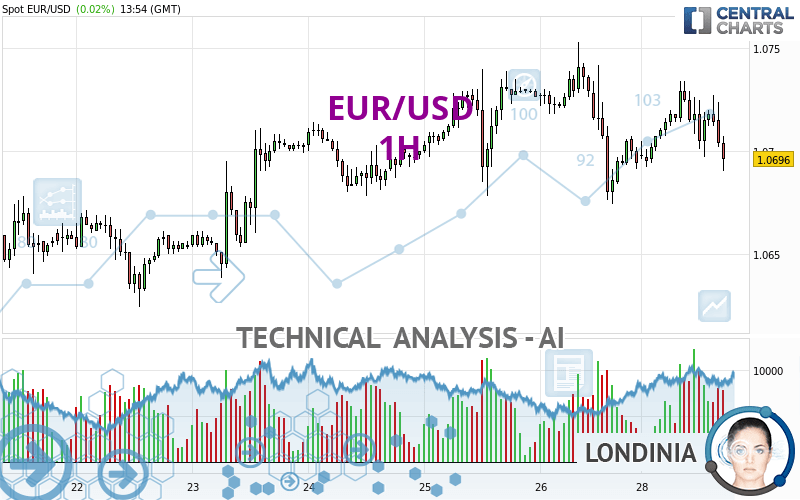
EUR/USD - 1H - Technical analysis published on 04/29/2024 (GMT)
- 57
- 0
Click here for a new analysis!
- Timeframe : 1H
- - Analysis generated on
- Status : INVALID

Summary of the analysis

Additional analysis
Quotes
The EUR/USD rating is 1.0696 USD. The price has increased by +0.02% since the last closing with the lowest point at 1.0690 USD and the highest point at 1.0734 USD. The deviation from the price is +0.06% for the low point and -0.35% for the high point.A bullish opening was detected by the Central Gaps scanner. Buyers are trying to impose a bullish momentum in the very short term.
Bullish opening
Type : Bullish
Timeframe : Openning
So that you have an overall view of the price change, here is a table showing the variations over several periods:
Near a new LOW record (1 year)
Type : Bearish
Timeframe : Weekly
Near a new HIGH record (1st january)
Type : Bullish
Timeframe : Weekly
Near a new HIGH record (1 month)
Type : Bullish
Timeframe : Weekly
Technical
A technical analysis in 1H of this EUR/USD chart shows a slightly bearish trend. 53.57% of the signals given by moving averages are bearish. This bearish trend does not seem to be increasing given the slightly bearish signals given by short-term moving averages. The Central Indicators scanner detects bearish signals on moving averages that could impact this trend:
Bearish trend reversal : adaptative moving average 20
Type : Bearish
Timeframe : 1 hour
Bearish trend reversal : adaptative moving average 50
Type : Bearish
Timeframe : 1 hour
Bearish price crossover with adaptative moving average 100
Type : Bearish
Timeframe : 1 hour
An assessment of technical indicators does not currently provide any relevant information on the direction of future price movements.
Caution: the Central Indicators scanner currently detects an excess:
CCI indicator is oversold : under -100
Type : Neutral
Timeframe : 1 hour
Williams %R indicator is oversold : under -80
Type : Neutral
Timeframe : 1 hour
MACD indicator is back under 0
Type : Bearish
Timeframe : 1 hour
Price is back under the pivot point
Type : Bearish
Timeframe : 1 hour
The analysis of the price chart with Central Patterns scanners does not return any result.
The Central Candlesticks scanner, specialised in Japanese candlesticks, did not identify any signals.
| S3 | S2 | S1 | Price | R1 | R2 | R3 | |
|---|---|---|---|---|---|---|---|
| ProTrendLines | 1.0638 | 1.0664 | 1.0678 | 1.0696 | 1.0708 | 1.0740 | 1.0753 |
| Change (%) | -0.54% | -0.30% | -0.17% | - | +0.11% | +0.41% | +0.53% |
| Change | -0.0058 | -0.0032 | -0.0018 | - | +0.0012 | +0.0044 | +0.0057 |
| Level | Major | Minor | Major | - | Major | Minor | Intermediate |
Pivot points can also be used to set your price objectives. Here is the price situation in relation to pivot points:
| Pivot points | S3 | S2 | S1 | PP | R1 | R2 | R3 |
|---|---|---|---|---|---|---|---|
| Standard | 1.0582 | 1.0628 | 1.0661 | 1.0707 | 1.0740 | 1.0786 | 1.0819 |
| Camarilla | 1.0672 | 1.0680 | 1.0687 | 1.0694 | 1.0701 | 1.0709 | 1.0716 |
| Woodie | 1.0576 | 1.0625 | 1.0655 | 1.0704 | 1.0734 | 1.0783 | 1.0813 |
| Fibonacci | 1.0628 | 1.0658 | 1.0677 | 1.0707 | 1.0737 | 1.0756 | 1.0786 |
| Pivot points | S3 | S2 | S1 | PP | R1 | R2 | R3 |
|---|---|---|---|---|---|---|---|
| Standard | 1.0499 | 1.0561 | 1.0628 | 1.0690 | 1.0757 | 1.0819 | 1.0886 |
| Camarilla | 1.0659 | 1.0670 | 1.0682 | 1.0694 | 1.0706 | 1.0718 | 1.0730 |
| Woodie | 1.0501 | 1.0562 | 1.0630 | 1.0691 | 1.0759 | 1.0820 | 1.0888 |
| Fibonacci | 1.0561 | 1.0611 | 1.0641 | 1.0690 | 1.0740 | 1.0770 | 1.0819 |
| Pivot points | S3 | S2 | S1 | PP | R1 | R2 | R3 |
|---|---|---|---|---|---|---|---|
| Standard | 1.0498 | 1.0633 | 1.0712 | 1.0847 | 1.0926 | 1.1061 | 1.1140 |
| Camarilla | 1.0733 | 1.0753 | 1.0772 | 1.0792 | 1.0812 | 1.0831 | 1.0851 |
| Woodie | 1.0471 | 1.0619 | 1.0685 | 1.0833 | 1.0899 | 1.1047 | 1.1113 |
| Fibonacci | 1.0633 | 1.0714 | 1.0765 | 1.0847 | 1.0928 | 1.0979 | 1.1061 |
Numerical data
The following are the details of the technical indicators and moving averages that were collected to generate this technical analysis:
| RSI (14): | 41.65 | |
| MACD (12,26,9): | -0.0001 | |
| Directional Movement: | -8.2562 | |
| AROON (14): | -64.2857 | |
| DEMA (21): | 1.0709 | |
| Parabolic SAR (0,02-0,02-0,2): | 1.0684 | |
| Elder Ray (13): | -0.0011 | |
| Super Trend (3,10): | 1.0732 | |
| Zig ZAG (10): | 1.0693 | |
| VORTEX (21): | 0.9888 | |
| Stochastique (14,3,5): | 24.56 | |
| TEMA (21): | 1.0708 | |
| Williams %R (14): | -97.73 | |
| Chande Momentum Oscillator (20): | -0.0023 | |
| Repulse (5,40,3): | -0.3027 | |
| ROCnROLL: | 2 | |
| TRIX (15,9): | -0.0002 | |
| Courbe Coppock: | 0.10 |
| MA7: | 1.0689 | |
| MA20: | 1.0725 | |
| MA50: | 1.0803 | |
| MA100: | 1.0842 | |
| MAexp7: | 1.0708 | |
| MAexp20: | 1.0711 | |
| MAexp50: | 1.0711 | |
| MAexp100: | 1.0703 | |
| Price / MA7: | +0.07% | |
| Price / MA20: | -0.27% | |
| Price / MA50: | -0.99% | |
| Price / MA100: | -1.35% | |
| Price / MAexp7: | -0.11% | |
| Price / MAexp20: | -0.14% | |
| Price / MAexp50: | -0.14% | |
| Price / MAexp100: | -0.07% |
News
The last news published on EUR/USD at the time of the generation of this analysis was as follows:
-
 EUR/USD Daily Forecast and Technical Analysis for April 29, 2024, by Chris Lewis for FX Empire
-
EUR/USD Long Term Forecast and Technical Analysis for April 26, 2024, by Chris Lewis for FX Empire
-
EUR/USD Daily Forecast and Technical Analysis for April 26, 2024, by Chris Lewis for FX Empire
-
EUR/USD Daily Forecast and Technical Analysis for April 25, 2024, by Chris Lewis for FX Empire
-
EUR/USD Forecast April 26, 2024
About author

Online


Add a comment
Comments
0 comments on the analysis EUR/USD - 1H