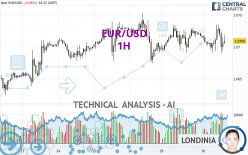
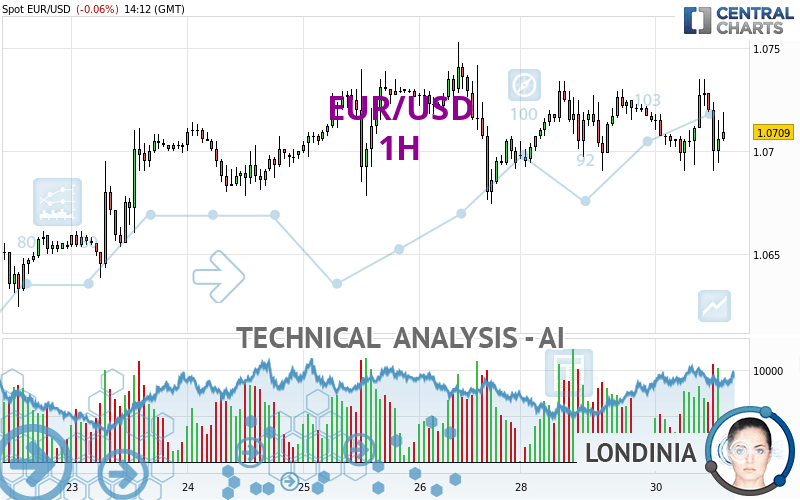
EUR/USD - 1H - Technical analysis published on 04/30/2024 (GMT)
- 78
- 0
- Timeframe : 1H
- - Analysis generated on
- Status : NEUTRAL
Summary of the analysis

Additional analysis
Quotes
EUR/USD rating 1.0709 USD. The price is lower by -0.06% since the last closing and was between 1.0690 USD and 1.0735 USD. This implies that the price is at +0.18% from its lowest and at -0.24% from its highest.So that you have an overall view of the price change, here is a table showing the variations over several periods:
Near a new LOW record (1 year)
Type : Bearish
Timeframe : Weekly
Near a new HIGH record (1st january)
Type : Bullish
Timeframe : Weekly
Near a new HIGH record (1 month)
Type : Bullish
Timeframe : Weekly
Technical
Technical analysis of EUR/USD in 1H shows a neutral overall trend. This indecision could turn into a bearish trend due to the slightly bearish signals currently given by short-term moving averages. The Central Indicators scanner detects bullish signals on moving averages that could impact this trend:
Bullish price crossover with Moving Average 20
Type : Bullish
Timeframe : 1 hour
Bullish price crossover with Moving Average 50
Type : Bullish
Timeframe : 1 hour
Bullish price crossover with adaptative moving average 20
Type : Bullish
Timeframe : 1 hour
Bullish price crossover with adaptative moving average 50
Type : Bullish
Timeframe : 1 hour
Bullish price crossover with adaptative moving average 100
Type : Bullish
Timeframe : 1 hour
The technical indicators are generally neutral. They do not provide relevant information on the direction of future price movements.
Other results related to technical indicators were also found by the Central Indicators scanner:
RSI indicator is back over 50
Type : Bullish
Timeframe : 1 hour
MACD crosses UP its Moving Average
Type : Bullish
Timeframe : 1 hour
Ichimoku : price is over the cloud
Type : Bullish
Timeframe : 1 hour
Momentum indicator is back over 0
Type : Bullish
Timeframe : 1 hour
Williams %R indicator is back over -50
Type : Bullish
Timeframe : 1 hour
Central Patterns, the market scanner focusing on chart patterns, resistances and supports found these results:
Near support of channel
Type : Bullish
Timeframe : 1 hour
Near support of triangle
Type : Bullish
Timeframe : 1 hour
The Central Candlesticks scanner, specialised in Japanese candlesticks, did not identify any signals.
| S3 | S2 | S1 | Price | R1 | R2 | R3 | |
|---|---|---|---|---|---|---|---|
| ProTrendLines | 1.0638 | 1.0678 | 1.0708 | 1.0709 | 1.0734 | 1.0753 | 1.0862 |
| Change (%) | -0.66% | -0.29% | -0.01% | - | +0.23% | +0.41% | +1.43% |
| Change | -0.0071 | -0.0031 | -0.0001 | - | +0.0025 | +0.0044 | +0.0153 |
| Level | Major | Major | Intermediate | - | Minor | Intermediate | Minor |
To determine price objectives, it is also possible to use the pivot points. Here is the price position in relation to pivot points:
| Pivot points | S3 | S2 | S1 | PP | R1 | R2 | R3 |
|---|---|---|---|---|---|---|---|
| Standard | 1.0648 | 1.0669 | 1.0692 | 1.0713 | 1.0736 | 1.0757 | 1.0780 |
| Camarilla | 1.0703 | 1.0707 | 1.0711 | 1.0715 | 1.0719 | 1.0723 | 1.0727 |
| Woodie | 1.0649 | 1.0670 | 1.0693 | 1.0714 | 1.0737 | 1.0758 | 1.0781 |
| Fibonacci | 1.0669 | 1.0686 | 1.0696 | 1.0713 | 1.0730 | 1.0740 | 1.0757 |
| Pivot points | S3 | S2 | S1 | PP | R1 | R2 | R3 |
|---|---|---|---|---|---|---|---|
| Standard | 1.0499 | 1.0561 | 1.0628 | 1.0690 | 1.0757 | 1.0819 | 1.0886 |
| Camarilla | 1.0659 | 1.0670 | 1.0682 | 1.0694 | 1.0706 | 1.0718 | 1.0730 |
| Woodie | 1.0501 | 1.0562 | 1.0630 | 1.0691 | 1.0759 | 1.0820 | 1.0888 |
| Fibonacci | 1.0561 | 1.0611 | 1.0641 | 1.0690 | 1.0740 | 1.0770 | 1.0819 |
| Pivot points | S3 | S2 | S1 | PP | R1 | R2 | R3 |
|---|---|---|---|---|---|---|---|
| Standard | 1.0498 | 1.0633 | 1.0712 | 1.0847 | 1.0926 | 1.1061 | 1.1140 |
| Camarilla | 1.0733 | 1.0753 | 1.0772 | 1.0792 | 1.0812 | 1.0831 | 1.0851 |
| Woodie | 1.0471 | 1.0619 | 1.0685 | 1.0833 | 1.0899 | 1.1047 | 1.1113 |
| Fibonacci | 1.0633 | 1.0714 | 1.0765 | 1.0847 | 1.0928 | 1.0979 | 1.1061 |
Numerical data
The following is the status of technical indicators and moving averages registered at the time this technical analysis was created:
| RSI (14): | 46.62 | |
| MACD (12,26,9): | -0.0001 | |
| Directional Movement: | -14.9069 | |
| AROON (14): | 21.4286 | |
| DEMA (21): | 1.0711 | |
| Parabolic SAR (0,02-0,02-0,2): | 1.0733 | |
| Elder Ray (13): | -0.0002 | |
| Super Trend (3,10): | 1.0693 | |
| Zig ZAG (10): | 1.0709 | |
| VORTEX (21): | 0.9313 | |
| Stochastique (14,3,5): | 32.59 | |
| TEMA (21): | 1.0710 | |
| Williams %R (14): | -55.56 | |
| Chande Momentum Oscillator (20): | 0.0003 | |
| Repulse (5,40,3): | -0.0127 | |
| ROCnROLL: | 1 | |
| TRIX (15,9): | -0.0006 | |
| Courbe Coppock: | 0.04 |
| MA7: | 1.0701 | |
| MA20: | 1.0723 | |
| MA50: | 1.0802 | |
| MA100: | 1.0842 | |
| MAexp7: | 1.0713 | |
| MAexp20: | 1.0712 | |
| MAexp50: | 1.0712 | |
| MAexp100: | 1.0707 | |
| Price / MA7: | +0.07% | |
| Price / MA20: | -0.13% | |
| Price / MA50: | -0.86% | |
| Price / MA100: | -1.23% | |
| Price / MAexp7: | -0.04% | |
| Price / MAexp20: | -0.03% | |
| Price / MAexp50: | -0.03% | |
| Price / MAexp100: | +0.02% |
News
The last news published on EUR/USD at the time of the generation of this analysis was as follows:
-
 EUR/USD Daily Forecast and Technical Analysis for April 30, 2024, by Chris Lewis for FX Empire
-
Weekly Technical Outlook: 29/04/2024 - USDJPY, EURUSD, Oil
-
EUR/USD Daily Forecast and Technical Analysis for April 29, 2024, by Chris Lewis for FX Empire
-
EUR/USD Long Term Forecast and Technical Analysis for April 26, 2024, by Chris Lewis for FX Empire
-
EUR/USD Daily Forecast and Technical Analysis for April 26, 2024, by Chris Lewis for FX Empire
About author

Online


Add a comment
Comments
0 comments on the analysis EUR/USD - 1H