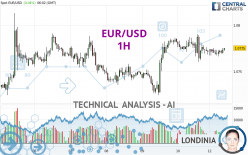
EUR/USD - 1H - Technical analysis published on 05/13/2024 (GMT)
- 77
- 0
Click here for a new analysis!
- Timeframe : 1H
- - Analysis generated on
- Status : TARGET REACHED

Summary of the analysis

Additional analysis
Quotes
The EUR/USD price is 1.0775 USD. The price registered an increase of +0.04% on the session and was traded between 1.0766 USD and 1.0775 USD over the period. The price is currently at +0.08% from its lowest and 0% from its highest.The Central Gaps scanner detects a bullish opening. A small advantage for buyers in the very short term.
Bullish opening
Type : Bullish
Timeframe : Openning
So that you have an overall view of the price change, here is a table showing the variations over several periods:
Near a new HIGH record (1 year)
Type : Bullish
Timeframe : Weekly
Near a new HIGH record (1st january)
Type : Bullish
Timeframe : Weekly
Near a new LOW record (1 month)
Type : Bearish
Timeframe : Weekly
Technical
A technical analysis in 1H of this EUR/USD chart shows a strongly bullish trend. 89.29% of the signals given by moving averages are bullish. The slightly bullish signals given by the short-term moving averages show a weakening of the global trend. The Central Indicators market scanner is currently detecting several bullish signals that could impact this trend:
Bullish price crossover with Moving Average 20
Type : Bullish
Timeframe : 1 hour
Bullish price crossover with adaptative moving average 20
Type : Bullish
Timeframe : 1 hour
An assessment of technical indicators shows a slightly bullish signal.
Central Indicators, the scanner specialised in technical indicators, has identified these signals:
RSI indicator is back over 50
Type : Bullish
Timeframe : 1 hour
Aroon indicator bearish trend
Type : Bearish
Timeframe : 1 hour
Price is back over the pivot point
Type : Bullish
Timeframe : 1 hour
Williams %R indicator is back over -50
Type : Bullish
Timeframe : 1 hour
An analysis of the price chart with the Central Patterns scanner (detector of chart patterns and resistances and supports) shows several results that can have an impact on the price change:
Near horizontal support
Type : Bullish
Timeframe : 1 hour
Support of channel is broken
Type : Bearish
Timeframe : 1 hour
The Central Candlesticks scanner, specialised in Japanese candlesticks, did not identify any signals.
| S3 | S2 | S1 | Price | R1 | R2 | R3 | |
|---|---|---|---|---|---|---|---|
| ProTrendLines | 1.0708 | 1.0734 | 1.0765 | 1.0775 | 1.0790 | 1.0813 | 1.0862 |
| Change (%) | -0.62% | -0.38% | -0.09% | - | +0.14% | +0.35% | +0.81% |
| Change | -0.0067 | -0.0041 | -0.0010 | - | +0.0015 | +0.0038 | +0.0087 |
| Level | Intermediate | Major | Major | - | Major | Intermediate | Minor |
To determine price objectives, it is also possible to use the pivot points. Here is the price position in relation to pivot points:
| Pivot points | S3 | S2 | S1 | PP | R1 | R2 | R3 |
|---|---|---|---|---|---|---|---|
| Standard | 1.0727 | 1.0744 | 1.0757 | 1.0774 | 1.0787 | 1.0804 | 1.0817 |
| Camarilla | 1.0763 | 1.0766 | 1.0768 | 1.0771 | 1.0774 | 1.0777 | 1.0779 |
| Woodie | 1.0726 | 1.0743 | 1.0756 | 1.0773 | 1.0786 | 1.0803 | 1.0816 |
| Fibonacci | 1.0744 | 1.0755 | 1.0762 | 1.0774 | 1.0785 | 1.0792 | 1.0804 |
| Pivot points | S3 | S2 | S1 | PP | R1 | R2 | R3 |
|---|---|---|---|---|---|---|---|
| Standard | 1.0666 | 1.0695 | 1.0733 | 1.0762 | 1.0800 | 1.0829 | 1.0867 |
| Camarilla | 1.0753 | 1.0759 | 1.0765 | 1.0771 | 1.0777 | 1.0783 | 1.0789 |
| Woodie | 1.0671 | 1.0697 | 1.0738 | 1.0764 | 1.0805 | 1.0831 | 1.0872 |
| Fibonacci | 1.0695 | 1.0721 | 1.0736 | 1.0762 | 1.0788 | 1.0803 | 1.0829 |
| Pivot points | S3 | S2 | S1 | PP | R1 | R2 | R3 |
|---|---|---|---|---|---|---|---|
| Standard | 1.0266 | 1.0433 | 1.0550 | 1.0717 | 1.0834 | 1.1001 | 1.1118 |
| Camarilla | 1.0588 | 1.0614 | 1.0640 | 1.0666 | 1.0692 | 1.0718 | 1.0744 |
| Woodie | 1.0240 | 1.0421 | 1.0524 | 1.0705 | 1.0808 | 1.0989 | 1.1092 |
| Fibonacci | 1.0433 | 1.0542 | 1.0609 | 1.0717 | 1.0826 | 1.0893 | 1.1001 |
Numerical data
The following are the details of the technical indicators and moving averages that were collected to generate this technical analysis:
| RSI (14): | 52.61 | |
| MACD (12,26,9): | 0.0000 | |
| Directional Movement: | -0.4233 | |
| AROON (14): | -78.5714 | |
| DEMA (21): | 1.0773 | |
| Parabolic SAR (0,02-0,02-0,2): | 1.0782 | |
| Elder Ray (13): | 0 | |
| Super Trend (3,10): | 1.0761 | |
| Zig ZAG (10): | 1.0774 | |
| VORTEX (21): | 0.9425 | |
| Stochastique (14,3,5): | 50.26 | |
| TEMA (21): | 1.0770 | |
| Williams %R (14): | -33.33 | |
| Chande Momentum Oscillator (20): | 0.0000 | |
| Repulse (5,40,3): | 0.0416 | |
| ROCnROLL: | 1 | |
| TRIX (15,9): | 0.0002 | |
| Courbe Coppock: | 0.06 |
| MA7: | 1.0765 | |
| MA20: | 1.0712 | |
| MA50: | 1.0787 | |
| MA100: | 1.0828 | |
| MAexp7: | 1.0771 | |
| MAexp20: | 1.0772 | |
| MAexp50: | 1.0769 | |
| MAexp100: | 1.0762 | |
| Price / MA7: | +0.09% | |
| Price / MA20: | +0.59% | |
| Price / MA50: | -0.11% | |
| Price / MA100: | -0.49% | |
| Price / MAexp7: | +0.04% | |
| Price / MAexp20: | +0.03% | |
| Price / MAexp50: | +0.06% | |
| Price / MAexp100: | +0.12% |
News
The latest news and videos published on EUR/USD at the time of the analysis were as follows:
-
 Trading volatility: EURUSD to move around US CPI inflation data?
-
EUR/USD Long Term Forecast and Technical Analysis for May 10, 2024, by Chris Lewis for FX Empire
-
EUR/USD Daily Forecast and Technical Analysis for May 10, 2024, by Chris Lewis for FX Empire
-
EUR/USD Daily Forecast and Technical Analysis for May 09, 2024, by Chris Lewis for FX Empire
-
EUR/USD Daily Forecast and Technical Analysis for May 08, 2024, by Chris Lewis for FX Empire
About author

Online


Add a comment
Comments
0 comments on the analysis EUR/USD - 1H