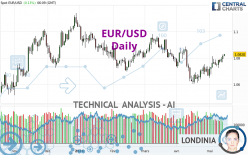
EUR/USD - Daily - Technical analysis published on 05/15/2024 (GMT)
- 74
- 0
Click here for a new analysis!
- Timeframe : Daily
- - Analysis generated on
- Status : LEVEL MAINTAINED

Summary of the analysis

Additional analysis
Quotes
EUR/USD rating 1.0828 USD. The price has increased by +0.13% since the last closing with the lowest point at 1.0813 USD and the highest point at 1.0829 USD. The deviation from the price is +0.14% for the low point and -0.01% for the high point.So that you have an overall view of the price change, here is a table showing the variations over several periods:
Near a new HIGH record (1 year)
Type : Bullish
Timeframe : Weekly
Near a new HIGH record (1st january)
Type : Bullish
Timeframe : Weekly
New HIGH record (1 month)
Type : Bullish
Timeframe : Weekly
Technical
A technical analysis in Daily of this EUR/USD chart shows a slightly bullish trend. Only 53.57% of the signals given by moving averages are bullish. This slightly bullish trend is reinforced by the strong signals currently being given by short-term moving averages. The Central Indicators scanner detects bullish signals on moving averages that could impact this trend:
Bullish trend reversal : adaptative moving average 100
Type : Bullish
Timeframe : Daily
Bullish price crossover with Moving Average 100
Type : Bullish
Timeframe : Daily
An assessment of technical indicators shows a strong bullish signal.
Caution: the Central Indicators scanner currently detects an excess:
CCI indicator is overbought : over 100
Type : Neutral
Timeframe : Daily
Williams %R indicator is overbought : over -20
Type : Neutral
Timeframe : Daily
Pivot points : price is over resistance 1
Type : Neutral
Timeframe : Weekly
Central Patterns, the market scanner focusing on chart patterns, resistances and supports found these results:
Near resistance of channel
Type : Bearish
Timeframe : Daily
Near resistance of triangle
Type : Bearish
Timeframe : Daily
The Central Candlesticks scanner which studies Japanese candlesticks did not detect anything.
| S3 | S2 | S1 | Price | R1 | R2 | R3 | |
|---|---|---|---|---|---|---|---|
| ProTrendLines | 1.0638 | 1.0708 | 1.0765 | 1.0828 | 1.0862 | 1.0953 | 1.1108 |
| Change (%) | -1.75% | -1.11% | -0.58% | - | +0.31% | +1.15% | +2.59% |
| Change | -0.0190 | -0.0120 | -0.0063 | - | +0.0034 | +0.0125 | +0.0280 |
| Level | Major | Intermediate | Intermediate | - | Minor | Major | Minor |
Pivot points can also be used to set your price objectives. Here is the price situation in relation to pivot points:
| Pivot points | S3 | S2 | S1 | PP | R1 | R2 | R3 |
|---|---|---|---|---|---|---|---|
| Standard | 1.0720 | 1.0743 | 1.0779 | 1.0802 | 1.0838 | 1.0861 | 1.0897 |
| Camarilla | 1.0798 | 1.0803 | 1.0809 | 1.0814 | 1.0819 | 1.0825 | 1.0830 |
| Woodie | 1.0726 | 1.0746 | 1.0785 | 1.0805 | 1.0844 | 1.0864 | 1.0903 |
| Fibonacci | 1.0743 | 1.0766 | 1.0780 | 1.0802 | 1.0825 | 1.0839 | 1.0861 |
| Pivot points | S3 | S2 | S1 | PP | R1 | R2 | R3 |
|---|---|---|---|---|---|---|---|
| Standard | 1.0666 | 1.0695 | 1.0733 | 1.0762 | 1.0800 | 1.0829 | 1.0867 |
| Camarilla | 1.0753 | 1.0759 | 1.0765 | 1.0771 | 1.0777 | 1.0783 | 1.0789 |
| Woodie | 1.0671 | 1.0697 | 1.0738 | 1.0764 | 1.0805 | 1.0831 | 1.0872 |
| Fibonacci | 1.0695 | 1.0721 | 1.0736 | 1.0762 | 1.0788 | 1.0803 | 1.0829 |
| Pivot points | S3 | S2 | S1 | PP | R1 | R2 | R3 |
|---|---|---|---|---|---|---|---|
| Standard | 1.0266 | 1.0433 | 1.0550 | 1.0717 | 1.0834 | 1.1001 | 1.1118 |
| Camarilla | 1.0588 | 1.0614 | 1.0640 | 1.0666 | 1.0692 | 1.0718 | 1.0744 |
| Woodie | 1.0240 | 1.0421 | 1.0524 | 1.0705 | 1.0808 | 1.0989 | 1.1092 |
| Fibonacci | 1.0433 | 1.0542 | 1.0609 | 1.0717 | 1.0826 | 1.0893 | 1.1001 |
Numerical data
The following is the status of technical indicators and moving averages registered at the time this technical analysis was created:
| RSI (14): | 61.44 | |
| MACD (12,26,9): | 0.0013 | |
| Directional Movement: | 8.5383 | |
| AROON (14): | 71.4286 | |
| DEMA (21): | 1.0766 | |
| Parabolic SAR (0,02-0,02-0,2): | 1.0706 | |
| Elder Ray (13): | 0.0053 | |
| Super Trend (3,10): | 1.0671 | |
| Zig ZAG (10): | 1.0827 | |
| VORTEX (21): | 1.1860 | |
| Stochastique (14,3,5): | 93.47 | |
| TEMA (21): | 1.0798 | |
| Williams %R (14): | 0.00 | |
| Chande Momentum Oscillator (20): | 0.0113 | |
| Repulse (5,40,3): | 0.5581 | |
| ROCnROLL: | 1 | |
| TRIX (15,9): | -0.0063 | |
| Courbe Coppock: | 1.93 |
| MA7: | 1.0783 | |
| MA20: | 1.0731 | |
| MA50: | 1.0785 | |
| MA100: | 1.0824 | |
| MAexp7: | 1.0789 | |
| MAexp20: | 1.0758 | |
| MAexp50: | 1.0771 | |
| MAexp100: | 1.0795 | |
| Price / MA7: | +0.42% | |
| Price / MA20: | +0.90% | |
| Price / MA50: | +0.40% | |
| Price / MA100: | +0.04% | |
| Price / MAexp7: | +0.36% | |
| Price / MAexp20: | +0.65% | |
| Price / MAexp50: | +0.53% | |
| Price / MAexp100: | +0.31% |
News
The last news published on EUR/USD at the time of the generation of this analysis was as follows:
-
 EUR/USD Daily Forecast and Technical Analysis for May 14, 2024, by Chris Lewis for FX Empire
-
EUR/USD Daily Forecast and Technical Analysis for May 13, 2024, by Chris Lewis for FX Empire
-
Trading volatility: EURUSD to move around US CPI inflation data?
-
EUR/USD Long Term Forecast and Technical Analysis for May 10, 2024, by Chris Lewis for FX Empire
-
EUR/USD Daily Forecast and Technical Analysis for May 10, 2024, by Chris Lewis for FX Empire
About author

Online


Add a comment
Comments
0 comments on the analysis EUR/USD - Daily