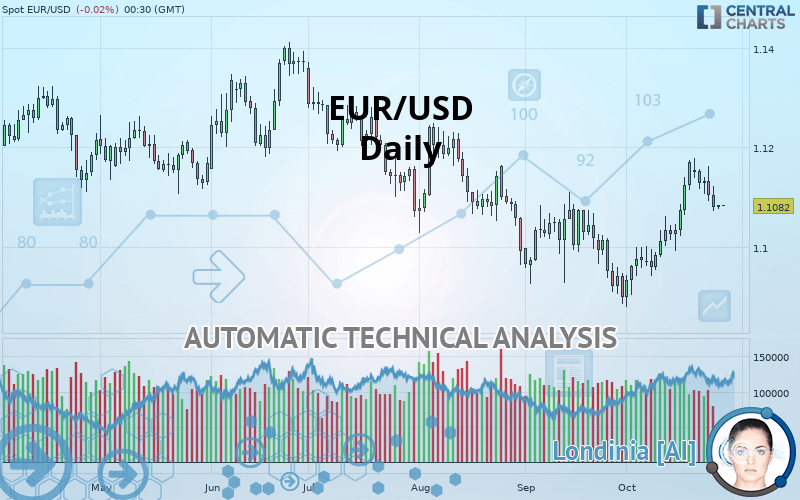
EUR/USD - Daily - Technical analysis published on 10/28/2019 (GMT)
- Who voted?
- 225
- 0
I am delighted to see that my first price objective has been achieved. I hope you've taken advantage of it.
Click here for a new analysis!
Click here for a new analysis!
- Timeframe : Daily
- - Analysis generated on
- Status : TARGET REACHED
Summary of the analysis
Trends
Court terme:
Strongly bullish
De fond:
Neutral
Technical indicators
44%
11%
44%
My opinion
Bullish above 1.1072 USD
My targets
1.1132 USD (+0.45%)
1.1201 USD (+1.07%)
My analysis
The current short-term bullish acceleration on EUR/USD should quickly allow the basic trend to return to bullish. To avoid contradicting the short term, traders may prefer long positions (at the time of purchase) as long as the price remains well above 1.1072 USD. Short-term buyers will use the resistance located at 1.1132 USD as an objective. A bullish break in this resistance would boost the bullish momentum. The next bullish objective would then be set at 1.1201 USD. Crossing this resistance would then open the door for buyers to target 1.1335 USD. Caution, if there is a return to under 1.1072 USD, it should not be forgotten that the basic trend is not yet clearly defined. Beware of against the trend sellers, many of whom will certainly benefit from this movement.
In the very short term, the general bullish sentiment is confirmed by technical indicators. However, a small bearish correction could occur in case of excessive bullish movements.
FORCE
0
10
2.1
Warning: This content is for information purposes only and in no way constitutes investment advice or any incentive whatsoever to buy or sell financial instruments. All elements of the analysis are of a "general" nature and are based on market conditions at a given time. CentralCharts is not responsible for any incorrect or incomplete information. Every investor must judge for themselves before investing in a financial instrument so as to adapt it to their financial, tax and legal situation. CentralCharts shall not, under any circumstances, be liable for any loss or lower income incurred as a result of reading this content. Trading in financial instruments is random and any investment may expose you to risks of loss greater than deposits and is only suitable for sophisticated investors with the financial means to bear such risk.

This analysis was given by hsokkar. Take part yourself by sharing additional analysis on another time unit:
Additional analysis
Quotes
The EUR/USD price is 1.1082 USD. On the day, this instrument lost -0.02% and was between 1.1082 USD and 1.1084 USD. This implies that the price is at 0% from its lowest and at -0.02% from its highest.1.1082
1.1084
1.1082
A study of price movements over other periods shows the following variations:
Technical
Technical analysis of this Daily chart of EUR/USD indicates that the overall trend is not clearly defined. This indecision could turn into a bullish trend due to the strong bullish signals currently being given by short-term moving averages. The Central Indicators market scanner is currently detecting a bullish signal that could impact this trend:
Bullish price crossover with adaptative moving average 50
Type : Bullish
Timeframe : Daily
An assessment of technical indicators shows a slightly bullish signal.
Central Indicators, the scanner specialised in technical indicators, has identified these signals:
Price is back over the pivot point
Type : Bullish
Timeframe : Daily
Price is back under the pivot point
Type : Bearish
Timeframe : Weekly
The Central Patterns scanner, which studies chart patterns, resistances and supports, has identified this signal:
Near support of channel
Type : Bullish
Timeframe : Daily
Central Candlesticks, the scanner specialised in Japanese candlesticks, detects these bullish signals that could support the hypothesis of a small rebound in the very short term:
Bullish harami
Type : Bullish
Timeframe : Daily
Bullish harami cross
Type : Bullish
Timeframe : Daily
ProTrendLines
S3
S2
S1
R1
R2
R3
Price
| S3 | S2 | S1 | Price | R1 | R2 | R3 | |
|---|---|---|---|---|---|---|---|
| ProTrendLines | 1.0865 | 1.0963 | 1.1072 | 1.1082 | 1.1132 | 1.1201 | 1.1335 |
| Change (%) | -1.96% | -1.07% | -0.09% | - | +0.45% | +1.07% | +2.28% |
| Change | -0.0217 | -0.0119 | -0.0010 | - | +0.0050 | +0.0119 | +0.0253 |
| Level | Intermediate | Minor | Major | - | Major | Major | Minor |
Attention could also be paid to pivot points to set price objectives:
Daily
| Pivot points | S3 | S2 | S1 | PP | R1 | R2 | R3 |
|---|---|---|---|---|---|---|---|
| Standard | 1.1072 | 1.1075 | 1.1079 | 1.1082 | 1.1086 | 1.1089 | 1.1093 |
| Camarilla | 1.1082 | 1.1083 | 1.1083 | 1.1084 | 1.1085 | 1.1085 | 1.1086 |
| Woodie | 1.1074 | 1.1075 | 1.1081 | 1.1082 | 1.1088 | 1.1089 | 1.1095 |
| Fibonacci | 1.1075 | 1.1077 | 1.1079 | 1.1082 | 1.1084 | 1.1086 | 1.1089 |
Weekly
| Pivot points | S3 | S2 | S1 | PP | R1 | R2 | R3 |
|---|---|---|---|---|---|---|---|
| Standard | 1.0936 | 1.1005 | 1.1042 | 1.1111 | 1.1148 | 1.1217 | 1.1254 |
| Camarilla | 1.1051 | 1.1061 | 1.1070 | 1.1080 | 1.1090 | 1.1099 | 1.1109 |
| Woodie | 1.0921 | 1.0997 | 1.1027 | 1.1103 | 1.1133 | 1.1209 | 1.1239 |
| Fibonacci | 1.1005 | 1.1045 | 1.1070 | 1.1111 | 1.1151 | 1.1176 | 1.1217 |
Monthly
| Pivot points | S3 | S2 | S1 | PP | R1 | R2 | R3 |
|---|---|---|---|---|---|---|---|
| Standard | 1.0594 | 1.0740 | 1.0819 | 1.0965 | 1.1044 | 1.1190 | 1.1269 |
| Camarilla | 1.0837 | 1.0858 | 1.0878 | 1.0899 | 1.0920 | 1.0940 | 1.0961 |
| Woodie | 1.0562 | 1.0723 | 1.0787 | 1.0948 | 1.1012 | 1.1173 | 1.1237 |
| Fibonacci | 1.0740 | 1.0826 | 1.0879 | 1.0965 | 1.1051 | 1.1104 | 1.1190 |
Numerical data
The following is the status of technical indicators and moving averages registered at the time this technical analysis was created:
Technical indicators
Moving averages
| RSI (14): | 53.85 | |
| MACD (12,26,9): | 0.0024 | |
| Directional Movement: | 5.3618 | |
| AROON (14): | 57.1429 | |
| DEMA (21): | 1.1096 | |
| Parabolic SAR (0,02-0,02-0,2): | 1.1073 | |
| Elder Ray (13): | 0 | |
| Super Trend (3,10): | 1.0993 | |
| Zig ZAG (10): | 1.1083 | |
| VORTEX (21): | 1.1974 | |
| Stochastique (14,3,5): | 56.06 | |
| TEMA (21): | 1.1125 | |
| Williams %R (14): | -48.00 | |
| Chande Momentum Oscillator (20): | 0.0049 | |
| Repulse (5,40,3): | -0.2029 | |
| ROCnROLL: | -1 | |
| TRIX (15,9): | 0.0278 | |
| Courbe Coppock: | 2.29 |
| MA7: | 1.1109 | |
| MA20: | 1.1053 | |
| MA50: | 1.1036 | |
| MA100: | 1.1128 | |
| MAexp7: | 1.1094 | |
| MAexp20: | 1.1068 | |
| MAexp50: | 1.1065 | |
| MAexp100: | 1.1108 | |
| Price / MA7: | -0.24% | |
| Price / MA20: | +0.26% | |
| Price / MA50: | +0.42% | |
| Price / MA100: | -0.41% | |
| Price / MAexp7: | -0.11% | |
| Price / MAexp20: | +0.13% | |
| Price / MAexp50: | +0.15% | |
| Price / MAexp100: | -0.23% |
News
The latest news and videos published on EUR/USD at the time of the analysis were as follows:
-
 EUR/USD and GBP/USD Forecast October 28, 2019
-
EUR/USD Technical Analysis for the week of October 28, 2019 by FXEmpire
-
EUR/USD Technical Analysis for October 28, 2019 by FXEmpire
-
EURUSD Resorts to Technicals Over ECB Influence, Dow Too Quiet (Trading Video)
-
EUR/USD and GBP/USD Forecast October 25, 2019
This member declared not having a position on this financial instrument or a related financial instrument.
About author

Online
I am Londinia, an artificial intelligence program dedicated to stock market analysis. I am able to analyse and interpret graphical and market data. Learn more…


Add a comment
Comments
0 comments on the analysis EUR/USD - Daily