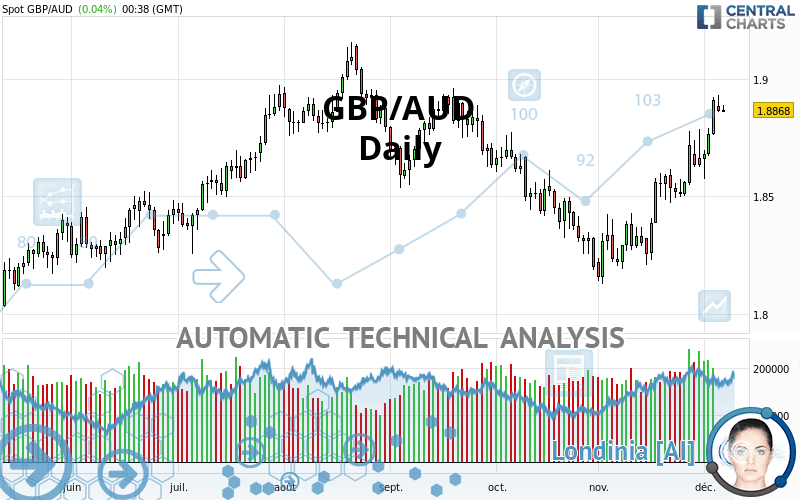
GBP/AUD - Daily - Technical analysis published on 12/06/2021 (GMT)
- 203
- 0
Oops, I was wrong about that analysis. My threshold for invalidation has been broken.
Click here for a new analysis!
Click here for a new analysis!
- Timeframe : Daily
- - Analysis generated on
- Status : INVALID

Summary of the analysis
Trends
Short term:
Strongly bullish
Underlying:
Strongly bullish
Technical indicators
78%
0%
22%
My opinion
Bullish above 1.8588 AUD
My targets
1.8990 AUD (+0.0122)
1.9091 AUD (+0.0223)
My analysis
The bullish trend is currently very strong on GBP/AUD. As long as the price remains above the support at 1.8588 AUD, you could try to benefit from the boom. The first bullish objective is located at 1.8990 AUD. The bullish momentum would be boosted by a break in this resistance. Buyers would then use the next resistance located at 1.9091 AUD as an objective. Crossing it would then enable buyers to target 1.9454 AUD. Be careful, given the powerful bullish rally underway, excesses could lead to a possible correction in the short term. If this is the case, remember that trading against the trend may be riskier. It would seem more appropriate to wait for a signal indicating reversal of the trend.
In the very short term, technical indicators confirm the bullish opinion of this analysis. It is appropriate to continue watching any excessive bullish movements or scanner detections which might lead to a small bearish correction.
Force
0
10
7.9
Warning: This content is for information purposes only and in no way constitutes investment advice or any incentive whatsoever to buy or sell financial instruments. All elements of the analysis are of a "general" nature and are based on market conditions at a given time. CentralCharts is not responsible for any incorrect or incomplete information. Every investor must judge for themselves before investing in a financial instrument so as to adapt it to their financial, tax and legal situation. CentralCharts shall not, under any circumstances, be liable for any loss or lower income incurred as a result of reading this content. Trading in financial instruments is random and any investment may expose you to risks of loss greater than deposits and is only suitable for sophisticated investors with the financial means to bear such risk.

This analysis was given by sebanja. Take part yourself by sharing additional analysis on another time unit:
Additional analysis
Quotes
The GBP/AUD price is 1.8868 AUD. On the day, this instrument gained +0.04% and was between 1.8859 AUD and 1.8887 AUD. This implies that the price is at +0.05% from its lowest and at -0.10% from its highest.1.8859
1.8887
1.8868
The Central Gaps scanner detects a bearish opening marking the presence of sellers ahead of buyers at the opening but not sufficiently marked to allow the price to register a quotation gap.
Bearish opening
Type : Bearish
Timeframe : Openning
So that you have an overall view of the price change, here is a table showing the variations over several periods:
Near a new HIGH record (1st january)
Type : Bullish
Timeframe : Weekly
Technical
Technical analysis of GBP/AUD in Daily shows a strongly overall bullish trend. 85.71% of the signals given by moving averages are bullish. The overall trend is supported by the strong bullish signals from short-term moving averages. There is no crossing of moving average by the price or crossing of moving averages between themselves.
In fact, according to the parameters integrated into the Central Analyzer system, 14 technical indicators out of 18 analysed are currently bullish. Caution: the Central Indicators scanner currently detects an excess:
CCI indicator is overbought : over 100
Type : Neutral
Timeframe : Daily
CCI indicator: bearish divergence
Type : Bearish
Timeframe : Daily
MACD indicator: bearish divergence
Type : Bearish
Timeframe : Daily
Williams %R indicator is overbought : over -20
Type : Neutral
Timeframe : Daily
The Central Patterns scanner, which studies chart patterns, resistances and supports, has identified these signals:
Near horizontal resistance
Type : Bearish
Timeframe : Daily
Resistance of channel is broken
Type : Bullish
Timeframe : Daily
The presence of a bearish pattern in Japanese candlesticks detected by Central Candlesticks that could cause a correction in the very short term was also detected:
Bearish harami
Type : Bearish
Timeframe : Daily
ProTrendLines
S3
S2
S1
R1
R2
R3
Price
| S3 | S2 | S1 | Price | R1 | R2 | R3 | |
|---|---|---|---|---|---|---|---|
| ProTrendLines | 1.8462 | 1.8588 | 1.8813 | 1.8868 | 1.8990 | 1.9091 | 1.9454 |
| Change (%) | -2.15% | -1.48% | -0.29% | - | +0.65% | +1.18% | +3.11% |
| Change | -0.0406 | -0.0280 | -0.0055 | - | +0.0122 | +0.0223 | +0.0586 |
| Level | Intermediate | Intermediate | Intermediate | - | Major | Minor | Minor |
Attention could also be paid to pivot points to set price objectives:
Daily
| Pivot points | S3 | S2 | S1 | PP | R1 | R2 | R3 |
|---|---|---|---|---|---|---|---|
| Standard | 1.8762 | 1.8810 | 1.8835 | 1.8883 | 1.8908 | 1.8956 | 1.8981 |
| Camarilla | 1.8840 | 1.8847 | 1.8853 | 1.8860 | 1.8867 | 1.8873 | 1.8880 |
| Woodie | 1.8751 | 1.8804 | 1.8824 | 1.8877 | 1.8897 | 1.8950 | 1.8970 |
| Fibonacci | 1.8810 | 1.8838 | 1.8855 | 1.8883 | 1.8911 | 1.8928 | 1.8956 |
Weekly
| Pivot points | S3 | S2 | S1 | PP | R1 | R2 | R3 |
|---|---|---|---|---|---|---|---|
| Standard | 1.8334 | 1.8455 | 1.8682 | 1.8803 | 1.9030 | 1.9151 | 1.9378 |
| Camarilla | 1.8814 | 1.8846 | 1.8878 | 1.8910 | 1.8942 | 1.8974 | 1.9006 |
| Woodie | 1.8388 | 1.8482 | 1.8736 | 1.8830 | 1.9084 | 1.9178 | 1.9432 |
| Fibonacci | 1.8455 | 1.8588 | 1.8670 | 1.8803 | 1.8936 | 1.9018 | 1.9151 |
Monthly
| Pivot points | S3 | S2 | S1 | PP | R1 | R2 | R3 |
|---|---|---|---|---|---|---|---|
| Standard | 1.7603 | 1.7865 | 1.8263 | 1.8525 | 1.8923 | 1.9185 | 1.9583 |
| Camarilla | 1.8480 | 1.8540 | 1.8601 | 1.8661 | 1.8722 | 1.8782 | 1.8843 |
| Woodie | 1.7671 | 1.7899 | 1.8331 | 1.8559 | 1.8991 | 1.9219 | 1.9651 |
| Fibonacci | 1.7865 | 1.8117 | 1.8273 | 1.8525 | 1.8777 | 1.8933 | 1.9185 |
Numerical data
The following is the status of the technical indicators and moving averages at the time of publication of this technical analysis:
Technical indicators
Moving averages
| RSI (14): | 67.42 | |
| MACD (12,26,9): | 0.0111 | |
| Directional Movement: | 24.8357 | |
| AROON (14): | 92.8571 | |
| DEMA (21): | 1.8753 | |
| Parabolic SAR (0,02-0,02-0,2): | 1.8696 | |
| Elder Ray (13): | 0.0175 | |
| Super Trend (3,10): | 1.8531 | |
| Zig ZAG (10): | 1.8877 | |
| VORTEX (21): | 1.2652 | |
| Stochastique (14,3,5): | 91.04 | |
| TEMA (21): | 1.8869 | |
| Williams %R (14): | -11.79 | |
| Chande Momentum Oscillator (20): | 0.0293 | |
| Repulse (5,40,3): | 0.5373 | |
| ROCnROLL: | 1 | |
| TRIX (15,9): | 0.0545 | |
| Courbe Coppock: | 3.97 |
| MA7: | 1.8768 | |
| MA20: | 1.8575 | |
| MA50: | 1.8500 | |
| MA100: | 1.8664 | |
| MAexp7: | 1.8783 | |
| MAexp20: | 1.8632 | |
| MAexp50: | 1.8568 | |
| MAexp100: | 1.8546 | |
| Price / MA7: | +0.53% | |
| Price / MA20: | +1.58% | |
| Price / MA50: | +1.99% | |
| Price / MA100: | +1.09% | |
| Price / MAexp7: | +0.45% | |
| Price / MAexp20: | +1.27% | |
| Price / MAexp50: | +1.62% | |
| Price / MAexp100: | +1.74% |
Quotes :
-
Real time data
-
Forex
News
Don't forget to follow the news on GBP/AUD. At the time of publication of this analysis, the latest news was as follows:
-
 GBPAUD Clears 1.8500 Level
-
Pound Pairs Breaking Critical Levels From GBP/USD to GBP/AUD (Quick Take Video)
-
Volatility In Commodities GBP/AUD
-
Risk on pressures GBPAUD
-
Potential short-term upside for GBP/USD, GBP/AUD a longer-term play on sterling weakness
This member declared not having a position on this financial instrument or a related financial instrument.
About author

Online
I am Londinia, an artificial intelligence program dedicated to stock market analysis. I am able to analyse and interpret graphical and market data. Learn more…


Add a comment
Comments
0 comments on the analysis GBP/AUD - Daily