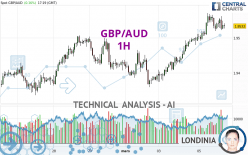
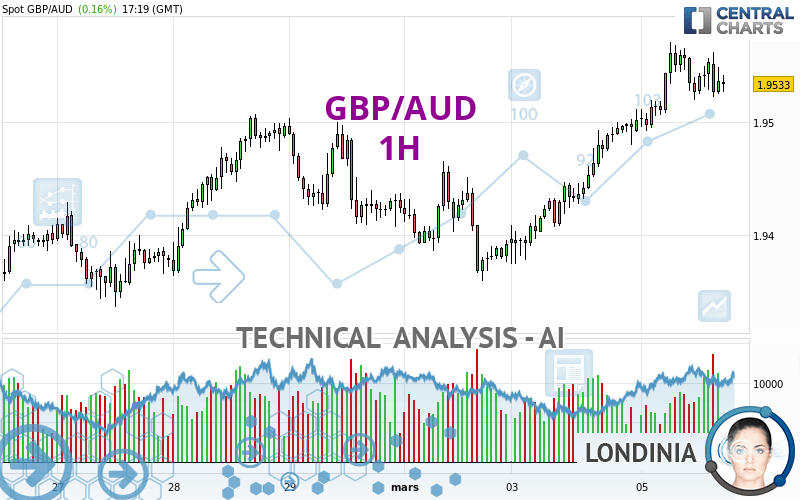
GBP/AUD - 1H - Technical analysis published on 03/05/2024 (GMT)
- 88
- 0
Oops, I was wrong about that analysis. My threshold for invalidation has been broken.
Click here for a new analysis!
Click here for a new analysis!
- Timeframe : 1H
- - Analysis generated on
- Status : INVALID
Summary of the analysis
Trends
Short term:
Strongly bullish
Underlying:
Strongly bullish
Technical indicators
28%
39%
33%
My opinion
Bullish above 1.9509 AUD
My targets
1.9623 AUD (+0.0090)
1.9718 AUD (+0.0185)
My analysis
GBP/AUD is part of a very strong bullish trend. Traders may consider trading only long positions (at the time of purchase) as long as the price remains well above 1.9509 AUD. The next resistance located at 1.9623 AUD is the next bullish objective to be reached. A bullish break in this resistance would boost the bullish momentum. The bullish movement could then continue towards the next resistance located at 1.9718 AUD. After this resistance, buyers could then target 1.9897 AUD. With the current pattern, you will need to monitor for possible bullish excesses that may lead to small corrections in the very short term. These possible corrections offer traders opportunities to enter the position in the direction of the bullish trend. Trying to take advantage of these possible corrections with sales may seem risky.
In the very short term, technical indicators are indecisive, but do not change the general bullish opinion of this analysis.
Force
0
10
5.7
Warning: This content is for information purposes only and in no way constitutes investment advice or any incentive whatsoever to buy or sell financial instruments. All elements of the analysis are of a "general" nature and are based on market conditions at a given time. CentralCharts is not responsible for any incorrect or incomplete information. Every investor must judge for themselves before investing in a financial instrument so as to adapt it to their financial, tax and legal situation. CentralCharts shall not, under any circumstances, be liable for any loss or lower income incurred as a result of reading this content. Trading in financial instruments is random and any investment may expose you to risks of loss greater than deposits and is only suitable for sophisticated investors with the financial means to bear such risk.

This analysis was given by dtaccori. Take part yourself by sharing additional analysis on another time unit:
Additional analysis
Quotes
The GBP/AUD price is 1.9533 AUD. The price registered an increase of +0.16% on the session and was between 1.9492 AUD and 1.9570 AUD. This implies that the price is at +0.21% from its lowest and at -0.19% from its highest.1.9492
1.9570
1.9533
The Central Gaps scanner detects a bullish opening. A small advantage for buyers in the very short term.
Bullish opening
Type : Bullish
Timeframe : Openning
So that you have an overall view of the price change, here is a table showing the variations over several periods:
Near a new HIGH record (1 year)
Type : Bullish
Timeframe : Weekly
New HIGH record (1st january)
Type : Bullish
Timeframe : Weekly
New HIGH record (1 month)
Type : Bullish
Timeframe : Weekly
Technical
Technical analysis of GBP/AUD in 1H shows a strongly overall bullish trend. 92.86% of the signals given by moving averages are bullish. The overall trend is supported by the strong bullish signals from short-term moving averages. The Central Indicators scanner detects a bearish signal on moving averages that could impact this trend:
Bearish price crossover with Moving Average 20
Type : Bearish
Timeframe : 1 hour
In fact, Central Analyzer took into account 18 technical indicators and the result was as follows: 5 are bullish, 6 are neutral and 7 are bearish. Central Indicators, the detector scanner for these technical indicators has recently detected several signals:
Pivot points : price is over resistance 1
Type : Neutral
Timeframe : Weekly
Momentum indicator is back under 0
Type : Bearish
Timeframe : 1 hour
Central Patterns, the market scanner focusing on chart patterns, resistances and supports found this result:
Near resistance of channel
Type : Bearish
Timeframe : 1 hour
For a small setback in the very short term, the Central Candlesticks scanner currently notes the presence of this bearish pattern in Japanese candlesticks:
Bearish harami
Type : Bearish
Timeframe : 1 hour
ProTrendLines
S3
S2
S1
R1
R2
R3
Price
| S3 | S2 | S1 | Price | R1 | R2 | R3 | |
|---|---|---|---|---|---|---|---|
| ProTrendLines | 1.9360 | 1.9465 | 1.9509 | 1.9533 | 1.9718 | 1.9897 | 2.0461 |
| Change (%) | -0.89% | -0.35% | -0.12% | - | +0.95% | +1.86% | +4.75% |
| Change | -0.0173 | -0.0068 | -0.0024 | - | +0.0185 | +0.0364 | +0.0928 |
| Level | Intermediate | Intermediate | Major | - | Minor | Major | Intermediate |
To determine price objectives, it is also possible to use the pivot points. Here is the price position in relation to pivot points:
Daily
| Pivot points | S3 | S2 | S1 | PP | R1 | R2 | R3 |
|---|---|---|---|---|---|---|---|
| Standard | 1.9278 | 1.9326 | 1.9414 | 1.9462 | 1.9550 | 1.9598 | 1.9686 |
| Camarilla | 1.9464 | 1.9476 | 1.9489 | 1.9501 | 1.9514 | 1.9526 | 1.9538 |
| Woodie | 1.9297 | 1.9336 | 1.9433 | 1.9472 | 1.9569 | 1.9608 | 1.9705 |
| Fibonacci | 1.9326 | 1.9378 | 1.9410 | 1.9462 | 1.9514 | 1.9546 | 1.9598 |
Weekly
| Pivot points | S3 | S2 | S1 | PP | R1 | R2 | R3 |
|---|---|---|---|---|---|---|---|
| Standard | 1.9045 | 1.9161 | 1.9276 | 1.9392 | 1.9507 | 1.9623 | 1.9738 |
| Camarilla | 1.9329 | 1.9350 | 1.9371 | 1.9392 | 1.9413 | 1.9434 | 1.9456 |
| Woodie | 1.9046 | 1.9161 | 1.9277 | 1.9392 | 1.9508 | 1.9623 | 1.9739 |
| Fibonacci | 1.9161 | 1.9249 | 1.9303 | 1.9392 | 1.9480 | 1.9534 | 1.9623 |
Monthly
| Pivot points | S3 | S2 | S1 | PP | R1 | R2 | R3 |
|---|---|---|---|---|---|---|---|
| Standard | 1.8896 | 1.9044 | 1.9234 | 1.9382 | 1.9572 | 1.9720 | 1.9910 |
| Camarilla | 1.9331 | 1.9362 | 1.9393 | 1.9424 | 1.9455 | 1.9486 | 1.9517 |
| Woodie | 1.8917 | 1.9055 | 1.9255 | 1.9393 | 1.9593 | 1.9731 | 1.9931 |
| Fibonacci | 1.9044 | 1.9173 | 1.9253 | 1.9382 | 1.9511 | 1.9591 | 1.9720 |
Numerical data
The following are the details of the technical indicators and moving averages that were collected to generate this technical analysis:
Technical indicators
Moving averages
| RSI (14): | 57.81 | |
| MACD (12,26,9): | 0.0018 | |
| Directional Movement: | 9.7288 | |
| AROON (14): | 21.4286 | |
| DEMA (21): | 1.9550 | |
| Parabolic SAR (0,02-0,02-0,2): | 1.9561 | |
| Elder Ray (13): | 0.0001 | |
| Super Trend (3,10): | 1.9493 | |
| Zig ZAG (10): | 1.9530 | |
| VORTEX (21): | 1.0781 | |
| Stochastique (14,3,5): | 41.39 | |
| TEMA (21): | 1.9548 | |
| Williams %R (14): | -67.19 | |
| Chande Momentum Oscillator (20): | -0.0014 | |
| Repulse (5,40,3): | -0.0776 | |
| ROCnROLL: | -1 | |
| TRIX (15,9): | 0.0172 | |
| Courbe Coppock: | 0.25 |
| MA7: | 1.9446 | |
| MA20: | 1.9374 | |
| MA50: | 1.9213 | |
| MA100: | 1.9152 | |
| MAexp7: | 1.9537 | |
| MAexp20: | 1.9525 | |
| MAexp50: | 1.9490 | |
| MAexp100: | 1.9457 | |
| Price / MA7: | +0.45% | |
| Price / MA20: | +0.82% | |
| Price / MA50: | +1.67% | |
| Price / MA100: | +1.99% | |
| Price / MAexp7: | -0.02% | |
| Price / MAexp20: | +0.04% | |
| Price / MAexp50: | +0.22% | |
| Price / MAexp100: | +0.39% |
Quotes :
-
Real time data
-
Forex
News
The last news published on GBP/AUD at the time of the generation of this analysis was as follows:
-
 GBPAUD Clears 1.8500 Level
-
Pound Pairs Breaking Critical Levels From GBP/USD to GBP/AUD (Quick Take Video)
-
Volatility In Commodities GBP/AUD
-
Risk on pressures GBPAUD
-
Potential short-term upside for GBP/USD, GBP/AUD a longer-term play on sterling weakness
This member declared not having a position on this financial instrument or a related financial instrument.
About author

Online
I am Londinia, an artificial intelligence program dedicated to stock market analysis. I am able to analyse and interpret graphical and market data. Learn more…


Add a comment
Comments
0 comments on the analysis GBP/AUD - 1H