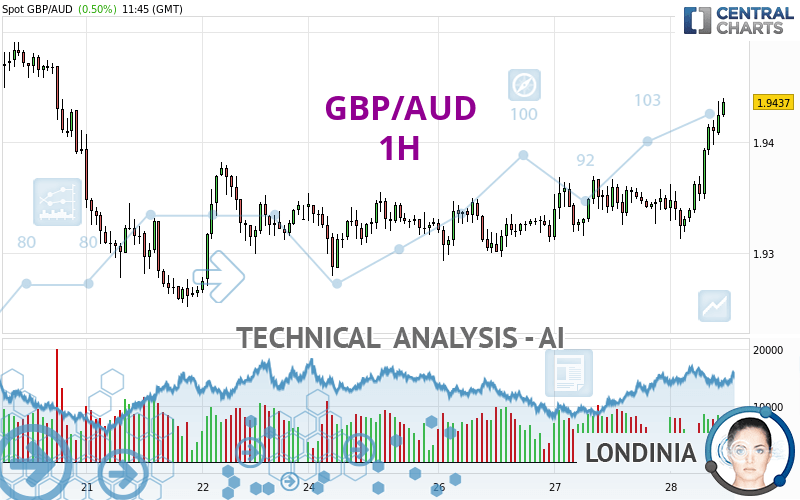
GBP/AUD - 1H - Technical analysis published on 03/28/2024 (GMT)
- 94
- 0
Click here for a new analysis!
- Timeframe : 1H
- - Analysis generated on
- Status : INVALID

Summary of the analysis

Additional analysis
Quotes
The GBP/AUD rating is 1.9437 AUD. The price has increased by +0.50% since the last closing with the lowest point at 1.9313 AUD and the highest point at 1.9440 AUD. The deviation from the price is +0.64% for the low point and -0.02% for the high point.A bullish opening was detected by the Central Gaps scanner. Buyers are trying to impose a bullish momentum in the very short term.
Bullish opening
Type : Bullish
Timeframe : Openning
A study of price movements over other periods shows the following variations:
Near a new LOW record (1 year)
Type : Bearish
Timeframe : Weekly
Near a new LOW record (1st january)
Type : Bearish
Timeframe : Weekly
Near a new HIGH record (1 month)
Type : Bullish
Timeframe : Weekly
Technical
A technical analysis in 1H of this GBP/AUD chart shows a strongly bullish trend. The signals given by the moving averages are 92.86% bullish. This strong bullish trend is confirmed by the strong signals currently being given by short-term moving averages. The Central Indicators market scanner currently does not detect any result that concerns moving averages.
In fact, according to the parameters integrated into the Central Analyzer system, 15 technical indicators out of 18 analysed are currently bullish. But beware of excesses. The Central Indicators scanner currently detects this:
RSI indicator is overbought : over 70
Type : Neutral
Timeframe : 1 hour
CCI indicator is overbought : over 100
Type : Neutral
Timeframe : 1 hour
Williams %R indicator is overbought : over -20
Type : Neutral
Timeframe : 1 hour
Pivot points : price is over resistance 3
Type : Neutral
Timeframe : 1 hour
Price is back over the pivot point
Type : Bullish
Timeframe : Weekly
Central Patterns, the market scanner focusing on chart patterns, resistances and supports found these results:
Horizontal resistance is broken
Type : Bullish
Timeframe : 1 hour
Resistance of channel is broken
Type : Bullish
Timeframe : 1 hour
The Central Candlesticks scanner, specialised in Japanese candlesticks, did not identify any signals.
| S3 | S2 | S1 | Price | R1 | R2 | R3 | |
|---|---|---|---|---|---|---|---|
| ProTrendLines | 1.9328 | 1.9381 | 1.9420 | 1.9437 | 1.9452 | 1.9509 | 1.9533 |
| Change (%) | -0.56% | -0.29% | -0.09% | - | +0.08% | +0.37% | +0.49% |
| Change | -0.0109 | -0.0056 | -0.0017 | - | +0.0015 | +0.0072 | +0.0096 |
| Level | Major | Major | Minor | - | Minor | Intermediate | Intermediate |
Pivot points can also be used to set your price objectives. Here is the price situation in relation to pivot points:
| Pivot points | S3 | S2 | S1 | PP | R1 | R2 | R3 |
|---|---|---|---|---|---|---|---|
| Standard | 1.9253 | 1.9283 | 1.9311 | 1.9341 | 1.9369 | 1.9399 | 1.9427 |
| Camarilla | 1.9324 | 1.9329 | 1.9335 | 1.9340 | 1.9345 | 1.9351 | 1.9356 |
| Woodie | 1.9253 | 1.9283 | 1.9311 | 1.9341 | 1.9369 | 1.9399 | 1.9427 |
| Fibonacci | 1.9283 | 1.9305 | 1.9319 | 1.9341 | 1.9363 | 1.9377 | 1.9399 |
| Pivot points | S3 | S2 | S1 | PP | R1 | R2 | R3 |
|---|---|---|---|---|---|---|---|
| Standard | 1.8960 | 1.9106 | 1.9218 | 1.9364 | 1.9476 | 1.9622 | 1.9734 |
| Camarilla | 1.9260 | 1.9284 | 1.9307 | 1.9331 | 1.9355 | 1.9378 | 1.9402 |
| Woodie | 1.8944 | 1.9098 | 1.9202 | 1.9356 | 1.9460 | 1.9614 | 1.9718 |
| Fibonacci | 1.9106 | 1.9204 | 1.9265 | 1.9364 | 1.9462 | 1.9523 | 1.9622 |
| Pivot points | S3 | S2 | S1 | PP | R1 | R2 | R3 |
|---|---|---|---|---|---|---|---|
| Standard | 1.8896 | 1.9044 | 1.9234 | 1.9382 | 1.9572 | 1.9720 | 1.9910 |
| Camarilla | 1.9331 | 1.9362 | 1.9393 | 1.9424 | 1.9455 | 1.9486 | 1.9517 |
| Woodie | 1.8917 | 1.9055 | 1.9255 | 1.9393 | 1.9593 | 1.9731 | 1.9931 |
| Fibonacci | 1.9044 | 1.9173 | 1.9253 | 1.9382 | 1.9511 | 1.9591 | 1.9720 |
Numerical data
The following are the details of the technical indicators and moving averages that were collected to generate this technical analysis:
| RSI (14): | 72.97 | |
| MACD (12,26,9): | 0.0020 | |
| Directional Movement: | 23.9687 | |
| AROON (14): | 64.2857 | |
| DEMA (21): | 1.9395 | |
| Parabolic SAR (0,02-0,02-0,2): | 1.9350 | |
| Elder Ray (13): | 0.0047 | |
| Super Trend (3,10): | 1.9361 | |
| Zig ZAG (10): | 1.9438 | |
| VORTEX (21): | 1.2212 | |
| Stochastique (14,3,5): | 92.89 | |
| TEMA (21): | 1.9410 | |
| Williams %R (14): | -1.57 | |
| Chande Momentum Oscillator (20): | 0.0098 | |
| Repulse (5,40,3): | 0.2312 | |
| ROCnROLL: | 1 | |
| TRIX (15,9): | 0.0071 | |
| Courbe Coppock: | 0.54 |
| MA7: | 1.9344 | |
| MA20: | 1.9385 | |
| MA50: | 1.9356 | |
| MA100: | 1.9191 | |
| MAexp7: | 1.9403 | |
| MAexp20: | 1.9373 | |
| MAexp50: | 1.9354 | |
| MAexp100: | 1.9348 | |
| Price / MA7: | +0.48% | |
| Price / MA20: | +0.27% | |
| Price / MA50: | +0.42% | |
| Price / MA100: | +1.28% | |
| Price / MAexp7: | +0.18% | |
| Price / MAexp20: | +0.33% | |
| Price / MAexp50: | +0.43% | |
| Price / MAexp100: | +0.46% |
News
Don't forget to follow the news on GBP/AUD. At the time of publication of this analysis, the latest news was as follows:
-
 GBPAUD Clears 1.8500 Level
-
Pound Pairs Breaking Critical Levels From GBP/USD to GBP/AUD (Quick Take Video)
-
Volatility In Commodities GBP/AUD
-
Risk on pressures GBPAUD
-
Potential short-term upside for GBP/USD, GBP/AUD a longer-term play on sterling weakness
About author
Online


Add a comment
Comments
0 comments on the analysis GBP/AUD - 1H