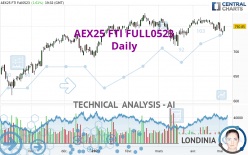
AEX25 FTI FULL0524 - Daily - Technical analysis published on 05/05/2023 (GMT)
- 142
- 0
Click here for a new analysis!
- Timeframe : Daily
- - Analysis generated on
- Status : TARGET REACHED
Summary of the analysis

Additional analysis
Quotes
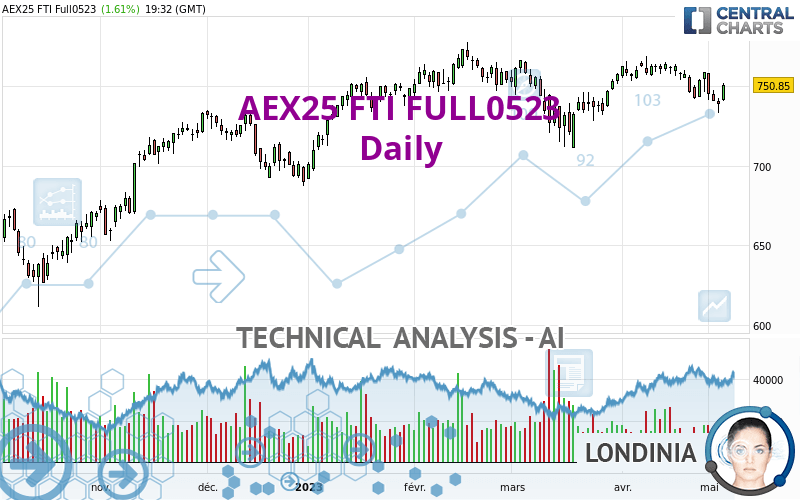
AEX25 FTI FULL0523 rating 750.85 EUR. The price registered an increase of +1.61% on the session and was traded between 740.55 EUR and 751.65 EUR over the period. The price is currently at +1.39% from its lowest and -0.11% from its highest.The Central Gaps scanner detects a bullish opening. A small advantage for buyers in the very short term.
Bullish opening
Type : Bullish
Timeframe : Openning
A study of price movements over other periods shows the following variations:
Near a new HIGH record (1 year)
Type : Bullish
Timeframe : Weekly
Near a new HIGH record (1st january)
Type : Bullish
Timeframe : Weekly
Near a new HIGH record (1 month)
Type : Bullish
Timeframe : Weekly
Technical
Technical analysis of this Daily chart of AEX25 FTI FULL0523 indicates that the overall trend is bullish. The signals given by moving averages are 75.00% bullish. This bullish trend is slowing down slightly given the slightly bullish signals of short-term moving averages. The Central Indicators scanner detects bullish signals on moving averages that could impact this trend:
Bullish price crossover with Moving Average 50
Type : Bullish
Timeframe : Daily
Bullish price crossover with Moving Average 100
Type : Bullish
Timeframe : Daily
Bullish price crossover with adaptative moving average 20
Type : Bullish
Timeframe : Daily
Technical indicators are slightly bullish. There is therefore considerable uncertainty about the continuation of the increase.
Caution: the Central Indicators scanner currently detects an excess:
Previous candle closed under Bollinger bands
Type : Neutral
Timeframe : Daily
RSI indicator: bullish divergence
Type : Bullish
Timeframe : Daily
Pivot points : price is over resistance 2
Type : Neutral
Timeframe : Daily
RSI indicator is back over 50
Type : Bullish
Timeframe : Daily
Ichimoku : price is over the cloud
Type : Bullish
Timeframe : Daily
Price is back under the pivot point
Type : Bearish
Timeframe : Weekly
Williams %R indicator is back over -50
Type : Bullish
Timeframe : Daily
No signals are given by Central Patterns, a market scanner specialised in chart patterns, resistances and supports.
For a small rebound in the very short term, the Central Candlesticks scanner currently notes the presence of this bullish pattern in Japanese candlesticks:
White morning star
Type : Bullish
Timeframe : Daily
| S3 | S2 | S1 | Price | R1 | R2 | R3 | |
|---|---|---|---|---|---|---|---|
| ProTrendLines | 664.80 | 686.58 | 727.06 | 750.85 | 758.51 | 770.03 | 805.34 |
| Change (%) | -11.46% | -8.56% | -3.17% | - | +1.02% | +2.55% | +7.26% |
| Change | -86.05 | -64.27 | -23.79 | - | +7.66 | +19.18 | +54.49 |
| Level | Minor | Minor | Major | - | Major | Intermediate | Major |
Attention could also be paid to pivot points to set price objectives:
| Pivot points | S3 | S2 | S1 | PP | R1 | R2 | R3 |
|---|---|---|---|---|---|---|---|
| Standard | 724.90 | 729.13 | 734.05 | 738.28 | 743.20 | 747.43 | 752.35 |
| Camarilla | 736.46 | 737.30 | 738.14 | 738.98 | 739.82 | 740.66 | 741.50 |
| Woodie | 725.26 | 729.30 | 734.41 | 738.45 | 743.56 | 747.60 | 752.71 |
| Fibonacci | 729.13 | 732.62 | 734.78 | 738.28 | 741.77 | 743.93 | 747.43 |
| Pivot points | S3 | S2 | S1 | PP | R1 | R2 | R3 |
|---|---|---|---|---|---|---|---|
| Standard | 726.60 | 734.08 | 745.30 | 752.78 | 764.00 | 771.48 | 782.70 |
| Camarilla | 751.39 | 753.10 | 754.82 | 756.53 | 758.24 | 759.96 | 761.67 |
| Woodie | 728.48 | 735.02 | 747.18 | 753.72 | 765.88 | 772.42 | 784.58 |
| Fibonacci | 734.08 | 741.22 | 745.63 | 752.78 | 759.92 | 764.33 | 771.48 |
| Pivot points | S3 | S2 | S1 | PP | R1 | R2 | R3 |
|---|---|---|---|---|---|---|---|
| Standard | 721.40 | 731.48 | 744.00 | 754.08 | 766.60 | 776.68 | 789.20 |
| Camarilla | 750.32 | 752.39 | 754.46 | 756.53 | 758.60 | 760.67 | 762.75 |
| Woodie | 722.63 | 732.09 | 745.23 | 754.69 | 767.83 | 777.29 | 790.43 |
| Fibonacci | 731.48 | 740.11 | 745.44 | 754.08 | 762.71 | 768.04 | 776.68 |
Numerical data
The following is the status of the technical indicators and moving averages at the time of publication of this technical analysis:
| RSI (14): | 51.96 | |
| MACD (12,26,9): | -0.0900 | |
| Directional Movement: | -2.04 | |
| AROON (14): | -50.00 | |
| DEMA (21): | 749.77 | |
| Parabolic SAR (0,02-0,02-0,2): | 756.85 | |
| Elder Ray (13): | -2.71 | |
| Super Trend (3,10): | 762.13 | |
| Zig ZAG (10): | 751.05 | |
| VORTEX (21): | 0.9100 | |
| Stochastique (14,3,5): | 32.12 | |
| TEMA (21): | 747.99 | |
| Williams %R (14): | -33.83 | |
| Chande Momentum Oscillator (20): | -7.65 | |
| Repulse (5,40,3): | 1.0000 | |
| ROCnROLL: | 1 | |
| TRIX (15,9): | 0.0300 | |
| Courbe Coppock: | 2.39 |
| MA7: | 746.79 | |
| MA20: | 752.59 | |
| MA50: | 745.95 | |
| MA100: | 739.44 | |
| MAexp7: | 747.29 | |
| MAexp20: | 749.13 | |
| MAexp50: | 746.26 | |
| MAexp100: | 736.68 | |
| Price / MA7: | +0.54% | |
| Price / MA20: | -0.23% | |
| Price / MA50: | +0.66% | |
| Price / MA100: | +1.54% | |
| Price / MAexp7: | +0.48% | |
| Price / MAexp20: | +0.23% | |
| Price / MAexp50: | +0.62% | |
| Price / MAexp100: | +1.92% |
About author

Online


Add a comment
Comments
0 comments on the analysis AEX25 FTI FULL0524 - Daily