GBP/JPY - Is Ready to Break The Ascending Trend Line - Level to Have in Mind - 08/17/2017 (GMT)
- Who voted?
- 281
- 0
- Timeframe : Daily
GBP/JPY Chart
Are you looking for opportunities in indices and forex?
DISCOVER LONDINIA OPPORTUNITIES...
DISCOVER LONDINIA OPPORTUNITIES...
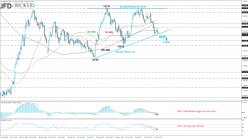
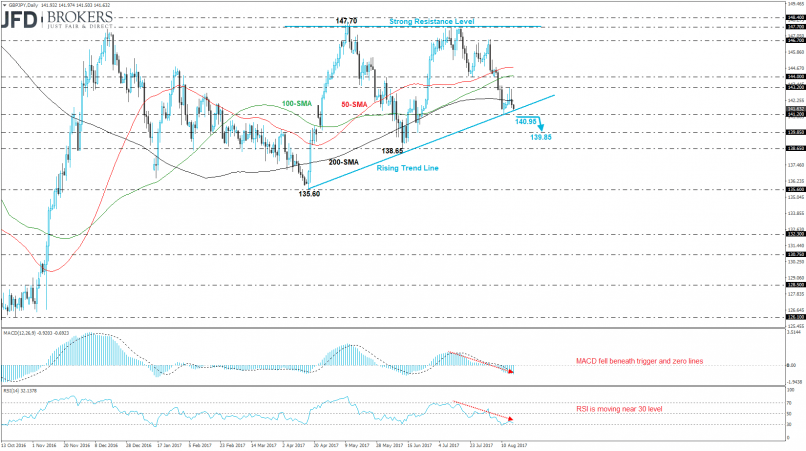
Sterling was developing within an ascending triangle against the Japanese yen since April, with significant resistance level at 147.70. Since last week the GBP/JPY pair sank almost 2% and it seems to be ready to break the referred pattern to the downside. Our expectation is a continuation of the falling tendency with first target the 139.85 support barrier, which overlaps with the 50-week SMA.
Technical indicators on the daily chart are biased lower on a daily basis. The MACD oscillator is moving below both its zero and trigger lines suggesting a stronger bearish momentum in the next few sessions. In addition, the Relative Strength Index (RSI) is following a downward path near 30, confirming the recent bearish attitude of the price.
Technical indicators on the daily chart are biased lower on a daily basis. The MACD oscillator is moving below both its zero and trigger lines suggesting a stronger bearish momentum in the next few sessions. In addition, the Relative Strength Index (RSI) is following a downward path near 30, confirming the recent bearish attitude of the price.
This member did not declare if he had a position on this financial instrument or a related financial instrument.
About author

Offline


Add a comment
Comments
0 comments on the analysis GBP/JPY - Daily