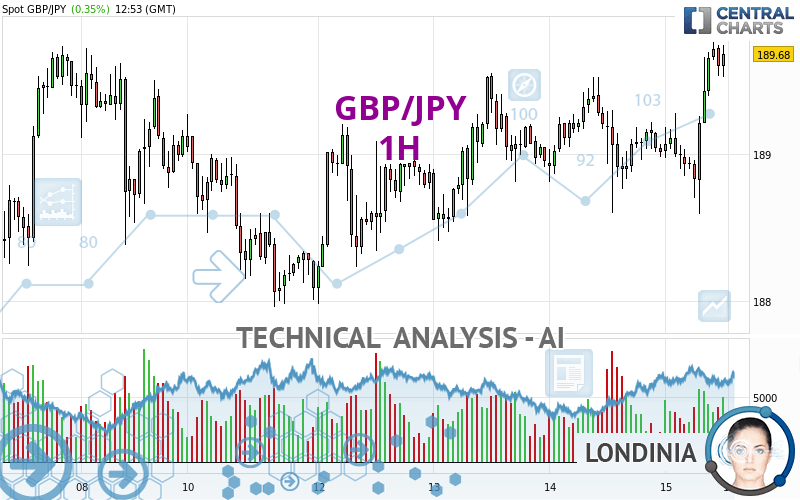
GBP/JPY - 1H - Technical analysis published on 03/15/2024 (GMT)
- 106
- 0
Click here for a new analysis!
- Timeframe : 1H
- - Analysis generated on
- Status : LEVEL MAINTAINED

Summary of the analysis

Additional analysis
Quotes
The GBP/JPY rating is 189.68 JPY. The price has increased by +0.35% since the last closing and was traded between 188.59 JPY and 189.76 JPY over the period. The price is currently at +0.58% from its lowest and -0.04% from its highest.A bullish opening was detected by the Central Gaps scanner. Buyers are trying to impose a bullish momentum in the very short term.
Bullish opening
Type : Bullish
Timeframe : Openning
A study of price movements over other periods shows the following variations:
Near a new HIGH record (5 years)
Type : Bullish
Timeframe : Weekly
Near a new HIGH record (1 year)
Type : Bullish
Timeframe : Weekly
Near a new HIGH record (1st january)
Type : Bullish
Timeframe : Weekly
Near a new HIGH record (1 month)
Type : Bullish
Timeframe : Weekly
Technical
Technical analysis of GBP/JPY in 1H shows a strongly overall bullish trend. The signals given by the moving averages are 92.86% bullish. This strong bullish trend is confirmed by the strong signals currently being given by short-term moving averages. The Central Indicators scanner does not detect any result on moving averages that would impact this trend.
The probability of a further increase is high given the direction of the technical indicators.
Caution: the Central Indicators scanner currently detects an excess:
CCI indicator is overbought : over 100
Type : Neutral
Timeframe : 1 hour
Williams %R indicator is overbought : over -20
Type : Neutral
Timeframe : 1 hour
Pivot points : price is over resistance 1
Type : Neutral
Timeframe : 1 hour
Price is back over the pivot point
Type : Bullish
Timeframe : Weekly
The Central Patterns scanner, which studies chart patterns, resistances and supports, has identified these signals:
Near horizontal resistance
Type : Bearish
Timeframe : 1 hour
Resistance of channel is broken
Type : Bullish
Timeframe : 1 hour
No result was found by the Central Candlesticks scanner on Japanese candlesticks.
| S3 | S2 | S1 | Price | R1 | R2 | R3 | |
|---|---|---|---|---|---|---|---|
| ProTrendLines | 187.96 | 188.39 | 189.49 | 189.68 | 190.31 | 190.69 | 190.97 |
| Change (%) | -0.91% | -0.68% | -0.10% | - | +0.33% | +0.53% | +0.68% |
| Change | -1.72 | -1.29 | -0.19 | - | +0.63 | +1.01 | +1.29 |
| Level | Minor | Major | Intermediate | - | Minor | Minor | Major |
Attention could also be paid to pivot points to set price objectives:
| Pivot points | S3 | S2 | S1 | PP | R1 | R2 | R3 |
|---|---|---|---|---|---|---|---|
| Standard | 187.65 | 188.12 | 188.57 | 189.04 | 189.49 | 189.96 | 190.41 |
| Camarilla | 188.76 | 188.84 | 188.93 | 189.01 | 189.09 | 189.18 | 189.26 |
| Woodie | 187.63 | 188.12 | 188.55 | 189.04 | 189.47 | 189.96 | 190.39 |
| Fibonacci | 188.12 | 188.48 | 188.69 | 189.04 | 189.40 | 189.61 | 189.96 |
| Pivot points | S3 | S2 | S1 | PP | R1 | R2 | R3 |
|---|---|---|---|---|---|---|---|
| Standard | 184.89 | 186.57 | 187.84 | 189.52 | 190.79 | 192.47 | 193.74 |
| Camarilla | 188.31 | 188.58 | 188.85 | 189.12 | 189.39 | 189.66 | 189.93 |
| Woodie | 184.70 | 186.47 | 187.65 | 189.42 | 190.60 | 192.37 | 193.55 |
| Fibonacci | 186.57 | 187.69 | 188.39 | 189.52 | 190.64 | 191.34 | 192.47 |
| Pivot points | S3 | S2 | S1 | PP | R1 | R2 | R3 |
|---|---|---|---|---|---|---|---|
| Standard | 179.95 | 182.59 | 186.04 | 188.68 | 192.13 | 194.77 | 198.22 |
| Camarilla | 187.82 | 188.37 | 188.93 | 189.49 | 190.05 | 190.61 | 191.17 |
| Woodie | 180.36 | 182.79 | 186.45 | 188.88 | 192.54 | 194.97 | 198.63 |
| Fibonacci | 182.59 | 184.92 | 186.35 | 188.68 | 191.01 | 192.44 | 194.77 |
Numerical data
The following is the status of the technical indicators and moving averages at the time of publication of this technical analysis:
| RSI (14): | 67.10 | |
| MACD (12,26,9): | 0.1300 | |
| Directional Movement: | 9.44 | |
| AROON (14): | 21.42 | |
| DEMA (21): | 189.41 | |
| Parabolic SAR (0,02-0,02-0,2): | 188.77 | |
| Elder Ray (13): | 0.28 | |
| Super Trend (3,10): | 188.95 | |
| Zig ZAG (10): | 189.66 | |
| VORTEX (21): | 1.1700 | |
| Stochastique (14,3,5): | 90.88 | |
| TEMA (21): | 189.51 | |
| Williams %R (14): | -9.40 | |
| Chande Momentum Oscillator (20): | 0.57 | |
| Repulse (5,40,3): | 0.1100 | |
| ROCnROLL: | 1 | |
| TRIX (15,9): | 0.0000 | |
| Courbe Coppock: | 0.41 |
| MA7: | 189.03 | |
| MA20: | 189.83 | |
| MA50: | 188.26 | |
| MA100: | 186.08 | |
| MAexp7: | 189.49 | |
| MAexp20: | 189.27 | |
| MAexp50: | 189.14 | |
| MAexp100: | 189.10 | |
| Price / MA7: | +0.34% | |
| Price / MA20: | -0.08% | |
| Price / MA50: | +0.75% | |
| Price / MA100: | +1.93% | |
| Price / MAexp7: | +0.10% | |
| Price / MAexp20: | +0.22% | |
| Price / MAexp50: | +0.29% | |
| Price / MAexp100: | +0.31% |
News
The last news published on GBP/JPY at the time of the generation of this analysis was as follows:
-
 Technical Analysis: 15/03/2024 - GBPJPY ticks up from rising trend line
-
Technical Analysis: 01/03/2024 - Will GBPJPY rebound again?
-
Technical Analysis: 09/02/2024 - GBPJPY works towards uptrend resumption
-
Pound/Yen Today: How to Capitalize on the Volatility of GBP/JPY | GBP/JPY Forecast February 6, 2024
-
GBP/JPY Forecast for February 06, 2024 by Chris Lewis for FXEmpire
About author

Online


Add a comment
Comments
0 comments on the analysis GBP/JPY - 1H