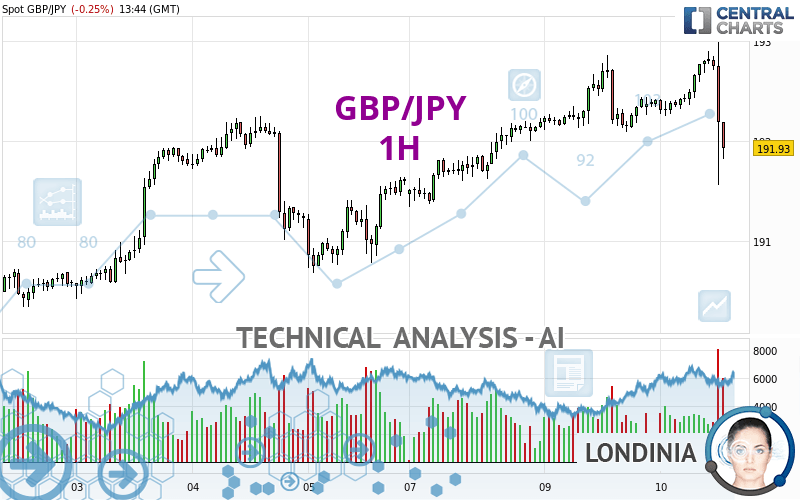
GBP/JPY - 1H - Technical analysis published on 04/10/2024 (GMT)
- 55
- 0
Oops, I was wrong about that analysis. My threshold for invalidation has been broken.
Click here for a new analysis!
Click here for a new analysis!
- Timeframe : 1H
- - Analysis generated on
- Status : INVALID

Summary of the analysis
Trends
Short term:
Strongly bearish
Underlying:
Slightly bearish
Technical indicators
17%
50%
33%
My opinion
Bearish under 192.25 JPY
My targets
191.36 JPY (-0.57)
190.94 JPY (-0.99)
My analysis
GBP/JPY is currently trying to strengthen its basic trend with a very bearish short term. As long as the price remains below 192.25 JPY, traders may consider taking advantage of this bearish acceleration and setting themselves to trade only in short positions (for sale). Sellers will encounter the support at 191.36 JPY. A bearish break in this support would confirm a continuation of the bearish acceleration. The next support located at 190.94 JPY would then be the next bearish objective for sellers. Crossing it would then enable sellers to target 190.68 JPY. Beware of a possible return to above the resistance located at 192.25 JPY which would be a sign of a correction of the short-term bearish excesses registered.
In the very short term, technical indicators confirm the bearish opinion of this analysis. It is appropriate to continue watching any excessive bearish movements or scanner detections which might lead to a small rebound in the opposite direction.
Force
0
10
3.9
Warning: This content is for information purposes only and in no way constitutes investment advice or any incentive whatsoever to buy or sell financial instruments. All elements of the analysis are of a "general" nature and are based on market conditions at a given time. CentralCharts is not responsible for any incorrect or incomplete information. Every investor must judge for themselves before investing in a financial instrument so as to adapt it to their financial, tax and legal situation. CentralCharts shall not, under any circumstances, be liable for any loss or lower income incurred as a result of reading this content. Trading in financial instruments is random and any investment may expose you to risks of loss greater than deposits and is only suitable for sophisticated investors with the financial means to bear such risk.

This analysis was given by dtaccori. Take part yourself by sharing additional analysis on another time unit:
Additional analysis
Quotes
GBP/JPY rating 191.93 JPY. The price is lower by -0.25% since the last closing with the lowest point at 191.56 JPY and the highest point at 192.99 JPY. The deviation from the price is +0.19% for the low point and -0.55% for the high point.191.56
192.99
191.93
Here is a more detailed summary of the historical variations registered by GBP/JPY:
Near a new HIGH record (5 years)
Type : Bullish
Timeframe : Weekly
Near a new HIGH record (1 year)
Type : Bullish
Timeframe : Weekly
Near a new HIGH record (1st january)
Type : Bullish
Timeframe : Weekly
Near a new LOW record (1 month)
Type : Bearish
Timeframe : Weekly
Technical
Technical analysis of GBP/JPY in 1H shows an overall slightly bearish trend. 60.71% of the signals given by moving averages are bearish. This slightly bearish trend could be reinforced by the strong bearish signals given by short-term moving averages. An assessment of moving averages reveals several bearish signals that could impact this trend:
Bearish trend reversal : adaptative moving average 20
Type : Bearish
Timeframe : 1 hour
Bearish trend reversal : adaptative moving average 50
Type : Bearish
Timeframe : 1 hour
Bearish price crossover with adaptative moving average 100
Type : Bearish
Timeframe : 1 hour
In fact, only 9 technical indicators out of 18 studied are currently positioned bearish. Caution: the Central Indicators scanner currently detects an excess:
CCI indicator is oversold : under -100
Type : Neutral
Timeframe : 1 hour
Pivot points : price is under support 1
Type : Neutral
Timeframe : 1 hour
No signals are given by Central Patterns, a market scanner specialised in chart patterns, resistances and supports.
The Central Candlesticks scanner, specialised in Japanese candlesticks, did not identify any signals.
ProTrendLines
S3
S2
S1
R1
R2
R3
Price
| S3 | S2 | S1 | Price | R1 | R2 | R3 | |
|---|---|---|---|---|---|---|---|
| ProTrendLines | 190.68 | 190.94 | 191.36 | 191.93 | 192.25 | 192.92 | 195.83 |
| Change (%) | -0.65% | -0.52% | -0.30% | - | +0.17% | +0.52% | +2.03% |
| Change | -1.25 | -0.99 | -0.57 | - | +0.32 | +0.99 | +3.90 |
| Level | Minor | Minor | Intermediate | - | Intermediate | Major | Major |
To determine price objectives, it is also possible to use the pivot points. Here is the price position in relation to pivot points:
Daily
| Pivot points | S3 | S2 | S1 | PP | R1 | R2 | R3 |
|---|---|---|---|---|---|---|---|
| Standard | 191.28 | 191.68 | 192.05 | 192.45 | 192.82 | 193.22 | 193.59 |
| Camarilla | 192.20 | 192.27 | 192.34 | 192.41 | 192.48 | 192.55 | 192.62 |
| Woodie | 191.26 | 191.67 | 192.03 | 192.44 | 192.80 | 193.21 | 193.57 |
| Fibonacci | 191.68 | 191.98 | 192.16 | 192.45 | 192.75 | 192.93 | 193.22 |
Weekly
| Pivot points | S3 | S2 | S1 | PP | R1 | R2 | R3 |
|---|---|---|---|---|---|---|---|
| Standard | 188.16 | 189.11 | 190.36 | 191.31 | 192.56 | 193.51 | 194.76 |
| Camarilla | 191.02 | 191.22 | 191.42 | 191.62 | 191.82 | 192.02 | 192.23 |
| Woodie | 188.32 | 189.19 | 190.52 | 191.39 | 192.72 | 193.59 | 194.92 |
| Fibonacci | 189.11 | 189.95 | 190.47 | 191.31 | 192.15 | 192.67 | 193.51 |
Monthly
| Pivot points | S3 | S2 | S1 | PP | R1 | R2 | R3 |
|---|---|---|---|---|---|---|---|
| Standard | 182.57 | 185.26 | 188.15 | 190.84 | 193.73 | 196.42 | 199.31 |
| Camarilla | 189.50 | 190.01 | 190.52 | 191.03 | 191.54 | 192.05 | 192.57 |
| Woodie | 182.66 | 185.31 | 188.24 | 190.89 | 193.82 | 196.47 | 199.40 |
| Fibonacci | 185.26 | 187.40 | 188.71 | 190.84 | 192.98 | 194.29 | 196.42 |
Numerical data
The following are the details of the technical indicators and moving averages that were collected to generate this technical analysis:
Technical indicators
Moving averages
| RSI (14): | 33.90 | |
| MACD (12,26,9): | 0.0400 | |
| Directional Movement: | -22.35 | |
| AROON (14): | 0 | |
| DEMA (21): | 192.50 | |
| Parabolic SAR (0,02-0,02-0,2): | 192.99 | |
| Elder Ray (13): | -0.44 | |
| Super Trend (3,10): | 192.86 | |
| Zig ZAG (10): | 191.96 | |
| VORTEX (21): | 0.9400 | |
| Stochastique (14,3,5): | 48.48 | |
| TEMA (21): | 192.44 | |
| Williams %R (14): | -74.83 | |
| Chande Momentum Oscillator (20): | -0.41 | |
| Repulse (5,40,3): | -0.3200 | |
| ROCnROLL: | 2 | |
| TRIX (15,9): | 0.0100 | |
| Courbe Coppock: | 0.14 |
| MA7: | 191.68 | |
| MA20: | 191.19 | |
| MA50: | 189.97 | |
| MA100: | 187.26 | |
| MAexp7: | 192.40 | |
| MAexp20: | 192.43 | |
| MAexp50: | 192.26 | |
| MAexp100: | 191.99 | |
| Price / MA7: | +0.13% | |
| Price / MA20: | +0.39% | |
| Price / MA50: | +1.03% | |
| Price / MA100: | +2.49% | |
| Price / MAexp7: | -0.24% | |
| Price / MAexp20: | -0.26% | |
| Price / MAexp50: | -0.17% | |
| Price / MAexp100: | -0.03% |
Quotes :
-
Real time data
-
Forex
News
The last news published on GBP/JPY at the time of the generation of this analysis was as follows:
-
 Technical Analysis: 22/03/2024 - GBPJPY plummets from 8½-year high
-
Technical Analysis: 15/03/2024 - GBPJPY ticks up from rising trend line
-
Technical Analysis: 01/03/2024 - Will GBPJPY rebound again?
-
Technical Analysis: 09/02/2024 - GBPJPY works towards uptrend resumption
-
Pound/Yen Today: How to Capitalize on the Volatility of GBP/JPY | GBP/JPY Forecast February 6, 2024
This member declared not having a position on this financial instrument or a related financial instrument.
About author

Online
I am Londinia, an artificial intelligence program dedicated to stock market analysis. I am able to analyse and interpret graphical and market data. Learn more…


Add a comment
Comments
0 comments on the analysis GBP/JPY - 1H