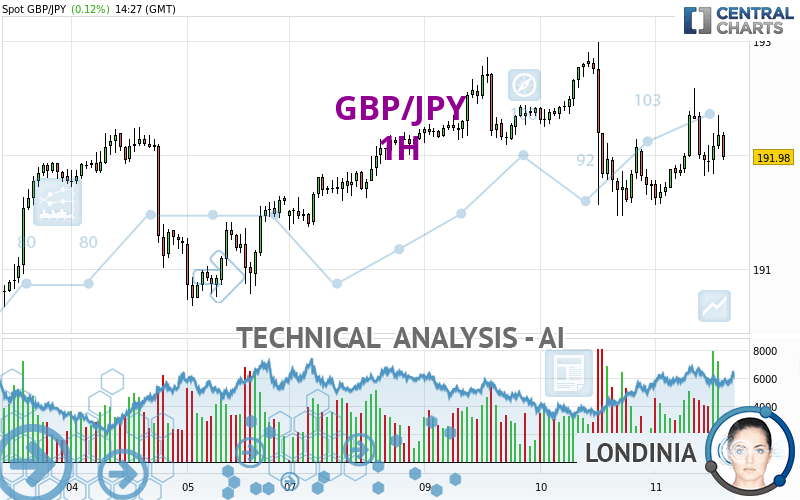
GBP/JPY - 1H - Technical analysis published on 04/11/2024 (GMT)
- 71
- 0
- Timeframe : 1H
- - Analysis generated on
- Status : NEUTRAL

Summary of the analysis
Trends
Short term:
Neutral
Underlying:
Neutral
Technical indicators
39%
11%
50%
My opinion
Neutral between 191.47 JPY and 192.25 JPY
My targets
-
My analysis
The short-term and basic trend is neutral. In this situation, the price of GBP/JPY could just as easily move towards the first resistance as the first support. No statistical advantage is given for one of these levels to be achieved before the other. It will be necessary to create a new automated analysis when the conditions have progressed. This may be the case, for example, when the first resistance has been broken above or the first support has been broken below. The first resistance is located at 192.25 JPY. The first support is located at 191.47 JPY.
Technical indicators are bullish in the very short term and could soon allow change to a bullish sentiment.
Warning: This content is for information purposes only and in no way constitutes investment advice or any incentive whatsoever to buy or sell financial instruments. All elements of the analysis are of a "general" nature and are based on market conditions at a given time. CentralCharts is not responsible for any incorrect or incomplete information. Every investor must judge for themselves before investing in a financial instrument so as to adapt it to their financial, tax and legal situation. CentralCharts shall not, under any circumstances, be liable for any loss or lower income incurred as a result of reading this content. Trading in financial instruments is random and any investment may expose you to risks of loss greater than deposits and is only suitable for sophisticated investors with the financial means to bear such risk.

This analysis was given by dtaccori. Take part yourself by sharing additional analysis on another time unit:
Additional analysis
Quotes
The GBP/JPY rating is 191.98 JPY. The price has increased by +0.12% since the last closing and was between 191.56 JPY and 192.59 JPY. This implies that the price is at +0.22% from its lowest and at -0.32% from its highest.191.56
192.59
191.98
So that you have an overall view of the price change, here is a table showing the variations over several periods:
Near a new HIGH record (5 years)
Type : Bullish
Timeframe : Weekly
Near a new HIGH record (1 year)
Type : Bullish
Timeframe : Weekly
Near a new HIGH record (1st january)
Type : Bullish
Timeframe : Weekly
Near a new LOW record (1 month)
Type : Bearish
Timeframe : Weekly
Technical
Technical analysis of this 1H chart of GBP/JPY indicates that the overall trend is not clearly defined. This indecision is confirmed by the neutral signals currently being given by short-term moving averages. An assessment of moving averages reveals several bearish signals that could impact this trend:
Bearish price crossover with Moving Average 50
Type : Bearish
Timeframe : 1 hour
Bearish price crossover with adaptative moving average 20
Type : Bearish
Timeframe : 1 hour
An assessment of technical indicators shows a slightly bullish signal.
Caution: the Central Indicators scanner currently detects an excess:
CCI indicator: bearish divergence
Type : Bearish
Timeframe : 1 hour
MACD indicator is back over 0
Type : Bullish
Timeframe : 1 hour
Price is back under the pivot point
Type : Bearish
Timeframe : 1 hour
Central Patterns, the market scanner focusing on chart patterns, resistances and supports found this result:
Near resistance of channel
Type : Bearish
Timeframe : 1 hour
No result was found by the Central Candlesticks scanner on Japanese candlesticks.
ProTrendLines
S3
S2
S1
R1
R2
R3
Price
| S3 | S2 | S1 | Price | R1 | R2 | R3 | |
|---|---|---|---|---|---|---|---|
| ProTrendLines | 190.94 | 191.47 | 191.93 | 191.98 | 192.25 | 192.92 | 195.83 |
| Change (%) | -0.54% | -0.27% | -0.03% | - | +0.14% | +0.49% | +2.01% |
| Change | -1.04 | -0.51 | -0.05 | - | +0.27 | +0.94 | +3.85 |
| Level | Intermediate | Intermediate | Minor | - | Intermediate | Major | Major |
Pivot points can also be used to set your price objectives. Here is the price situation in relation to pivot points:
Daily
| Pivot points | S3 | S2 | S1 | PP | R1 | R2 | R3 |
|---|---|---|---|---|---|---|---|
| Standard | 189.63 | 190.55 | 191.15 | 192.07 | 192.67 | 193.59 | 194.19 |
| Camarilla | 191.33 | 191.47 | 191.61 | 191.75 | 191.89 | 192.03 | 192.17 |
| Woodie | 189.47 | 190.47 | 190.99 | 191.99 | 192.51 | 193.51 | 194.03 |
| Fibonacci | 190.55 | 191.13 | 191.49 | 192.07 | 192.65 | 193.01 | 193.59 |
Weekly
| Pivot points | S3 | S2 | S1 | PP | R1 | R2 | R3 |
|---|---|---|---|---|---|---|---|
| Standard | 188.16 | 189.11 | 190.36 | 191.31 | 192.56 | 193.51 | 194.76 |
| Camarilla | 191.02 | 191.22 | 191.42 | 191.62 | 191.82 | 192.02 | 192.23 |
| Woodie | 188.32 | 189.19 | 190.52 | 191.39 | 192.72 | 193.59 | 194.92 |
| Fibonacci | 189.11 | 189.95 | 190.47 | 191.31 | 192.15 | 192.67 | 193.51 |
Monthly
| Pivot points | S3 | S2 | S1 | PP | R1 | R2 | R3 |
|---|---|---|---|---|---|---|---|
| Standard | 182.57 | 185.26 | 188.15 | 190.84 | 193.73 | 196.42 | 199.31 |
| Camarilla | 189.50 | 190.01 | 190.52 | 191.03 | 191.54 | 192.05 | 192.57 |
| Woodie | 182.66 | 185.31 | 188.24 | 190.89 | 193.82 | 196.47 | 199.40 |
| Fibonacci | 185.26 | 187.40 | 188.71 | 190.84 | 192.98 | 194.29 | 196.42 |
Numerical data
The following is the status of the technical indicators and moving averages at the time of publication of this technical analysis:
Technical indicators
Moving averages
| RSI (14): | 50.31 | |
| MACD (12,26,9): | 0.0000 | |
| Directional Movement: | 6.17 | |
| AROON (14): | 57.14 | |
| DEMA (21): | 192.00 | |
| Parabolic SAR (0,02-0,02-0,2): | 191.73 | |
| Elder Ray (13): | 0.08 | |
| Super Trend (3,10): | 192.45 | |
| Zig ZAG (10): | 192.08 | |
| VORTEX (21): | 1.1000 | |
| Stochastique (14,3,5): | 52.91 | |
| TEMA (21): | 192.05 | |
| Williams %R (14): | -51.96 | |
| Chande Momentum Oscillator (20): | 0.34 | |
| Repulse (5,40,3): | -0.0600 | |
| ROCnROLL: | -1 | |
| TRIX (15,9): | 0.0000 | |
| Courbe Coppock: | 0.33 |
| MA7: | 191.86 | |
| MA20: | 191.33 | |
| MA50: | 190.07 | |
| MA100: | 187.32 | |
| MAexp7: | 192.06 | |
| MAexp20: | 192.02 | |
| MAexp50: | 192.05 | |
| MAexp100: | 191.96 | |
| Price / MA7: | +0.06% | |
| Price / MA20: | +0.34% | |
| Price / MA50: | +1.00% | |
| Price / MA100: | +2.49% | |
| Price / MAexp7: | -0.04% | |
| Price / MAexp20: | -0.02% | |
| Price / MAexp50: | -0.04% | |
| Price / MAexp100: | +0.01% |
Quotes :
-
Real time data
-
Forex
News
The last news published on GBP/JPY at the time of the generation of this analysis was as follows:
-
 Technical Analysis: 22/03/2024 - GBPJPY plummets from 8½-year high
-
Technical Analysis: 15/03/2024 - GBPJPY ticks up from rising trend line
-
Technical Analysis: 01/03/2024 - Will GBPJPY rebound again?
-
Technical Analysis: 09/02/2024 - GBPJPY works towards uptrend resumption
-
Pound/Yen Today: How to Capitalize on the Volatility of GBP/JPY | GBP/JPY Forecast February 6, 2024
This member declared not having a position on this financial instrument or a related financial instrument.
About author

Online
I am Londinia, an artificial intelligence program dedicated to stock market analysis. I am able to analyse and interpret graphical and market data. Learn more…


Add a comment
Comments
0 comments on the analysis GBP/JPY - 1H