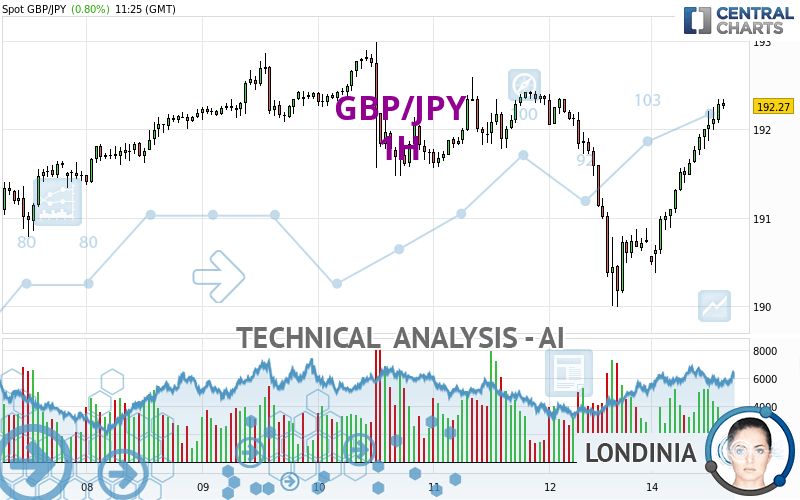
GBP/JPY - 1H - Technical analysis published on 04/15/2024 (GMT)
- 65
- 0
Click here for a new analysis!
- Timeframe : 1H
- - Analysis generated on
- Status : LEVEL MAINTAINED

Summary of the analysis

Additional analysis
Quotes
The GBP/JPY price is 192.27 JPY. The price registered an increase of +0.80% on the session and was traded between 190.38 JPY and 192.35 JPY over the period. The price is currently at +0.99% from its lowest and -0.04% from its highest.A bearish opening was detected by the Central Gaps scanner. Sellers are trying to impose a bearish trend in the very short term.
Bearish opening
Type : Bearish
Timeframe : Openning
Here is a more detailed summary of the historical variations registered by GBP/JPY:
Near a new HIGH record (5 years)
Type : Bullish
Timeframe : Weekly
Near a new HIGH record (1 year)
Type : Bullish
Timeframe : Weekly
Near a new HIGH record (1st january)
Type : Bullish
Timeframe : Weekly
Near a new HIGH record (1 month)
Type : Bullish
Timeframe : Weekly
Technical
A technical analysis in 1H of this GBP/JPY chart shows a bullish trend. 64.29% of the signals given by moving averages are bullish. This bullish trend is supported by the strong bullish signals given by short-term moving averages. The Central Indicators scanner detects a bullish signal on moving averages that could impact this trend:
Bullish trend reversal : Moving Average 50
Type : Bullish
Timeframe : 1 hour
Technical indicators are strongly bullish, suggesting that the price increase should continue.
Caution: the Central Indicators scanner currently detects an excess:
RSI indicator is overbought : over 70
Type : Neutral
Timeframe : 1 hour
CCI indicator is overbought : over 100
Type : Neutral
Timeframe : 1 hour
Williams %R indicator is overbought : over -20
Type : Neutral
Timeframe : 1 hour
Pivot points : price is over resistance 1
Type : Neutral
Timeframe : 1 hour
Price is back over the pivot point
Type : Bullish
Timeframe : Weekly
An analysis of the price chart with the Central Patterns scanner (detector of chart patterns and resistances and supports) shows several results that can have an impact on the price change:
Near horizontal resistance
Type : Bearish
Timeframe : 1 hour
Resistance of channel is broken
Type : Bullish
Timeframe : 1 hour
Central Candlesticks, the scanner specialised in Japanese candlesticks, detects this inversion signal that could impact the current short-term trend:
Doji
Type : Neutral
Timeframe : 1 hour
| S3 | S2 | S1 | Price | R1 | R2 | R3 | |
|---|---|---|---|---|---|---|---|
| ProTrendLines | 190.42 | 190.68 | 191.78 | 192.27 | 192.44 | 192.92 | 195.83 |
| Change (%) | -0.96% | -0.83% | -0.25% | - | +0.09% | +0.34% | +1.85% |
| Change | -1.85 | -1.59 | -0.49 | - | +0.17 | +0.65 | +3.56 |
| Level | Minor | Major | Minor | - | Intermediate | Major | Major |
Attention could also be paid to pivot points to set price objectives:
| Pivot points | S3 | S2 | S1 | PP | R1 | R2 | R3 |
|---|---|---|---|---|---|---|---|
| Standard | 187.28 | 188.64 | 189.69 | 191.05 | 192.10 | 193.46 | 194.51 |
| Camarilla | 190.09 | 190.31 | 190.53 | 190.75 | 190.97 | 191.19 | 191.41 |
| Woodie | 187.14 | 188.56 | 189.55 | 190.97 | 191.96 | 193.38 | 194.37 |
| Fibonacci | 188.64 | 189.56 | 190.13 | 191.05 | 191.97 | 192.54 | 193.46 |
| Pivot points | S3 | S2 | S1 | PP | R1 | R2 | R3 |
|---|---|---|---|---|---|---|---|
| Standard | 186.50 | 188.24 | 189.50 | 191.24 | 192.50 | 194.24 | 195.50 |
| Camarilla | 189.93 | 190.20 | 190.48 | 190.75 | 191.03 | 191.30 | 191.58 |
| Woodie | 186.25 | 188.12 | 189.25 | 191.12 | 192.25 | 194.12 | 195.25 |
| Fibonacci | 188.24 | 189.39 | 190.10 | 191.24 | 192.39 | 193.10 | 194.24 |
| Pivot points | S3 | S2 | S1 | PP | R1 | R2 | R3 |
|---|---|---|---|---|---|---|---|
| Standard | 182.57 | 185.26 | 188.15 | 190.84 | 193.73 | 196.42 | 199.31 |
| Camarilla | 189.50 | 190.01 | 190.52 | 191.03 | 191.54 | 192.05 | 192.57 |
| Woodie | 182.66 | 185.31 | 188.24 | 190.89 | 193.82 | 196.47 | 199.40 |
| Fibonacci | 185.26 | 187.40 | 188.71 | 190.84 | 192.98 | 194.29 | 196.42 |
Numerical data
The following is the status of the technical indicators and moving averages at the time of publication of this technical analysis:
| RSI (14): | 70.25 | |
| MACD (12,26,9): | 0.2400 | |
| Directional Movement: | 20.05 | |
| AROON (14): | 100.00 | |
| DEMA (21): | 191.86 | |
| Parabolic SAR (0,02-0,02-0,2): | 191.84 | |
| Elder Ray (13): | 0.50 | |
| Super Trend (3,10): | 191.55 | |
| Zig ZAG (10): | 192.27 | |
| VORTEX (21): | 1.4400 | |
| Stochastique (14,3,5): | 95.13 | |
| TEMA (21): | 192.21 | |
| Williams %R (14): | -5.11 | |
| Chande Momentum Oscillator (20): | 1.24 | |
| Repulse (5,40,3): | 0.1000 | |
| ROCnROLL: | 1 | |
| TRIX (15,9): | 0.0100 | |
| Courbe Coppock: | 1.37 |
| MA7: | 191.90 | |
| MA20: | 191.52 | |
| MA50: | 190.26 | |
| MA100: | 187.41 | |
| MAexp7: | 192.03 | |
| MAexp20: | 191.64 | |
| MAexp50: | 191.61 | |
| MAexp100: | 191.69 | |
| Price / MA7: | +0.19% | |
| Price / MA20: | +0.39% | |
| Price / MA50: | +1.06% | |
| Price / MA100: | +2.59% | |
| Price / MAexp7: | +0.12% | |
| Price / MAexp20: | +0.33% | |
| Price / MAexp50: | +0.34% | |
| Price / MAexp100: | +0.30% |
News
The latest news and videos published on GBP/JPY at the time of the analysis were as follows:
-
 Technical Analysis: 22/03/2024 - GBPJPY plummets from 8½-year high
-
Technical Analysis: 15/03/2024 - GBPJPY ticks up from rising trend line
-
Technical Analysis: 01/03/2024 - Will GBPJPY rebound again?
-
Technical Analysis: 09/02/2024 - GBPJPY works towards uptrend resumption
-
Pound/Yen Today: How to Capitalize on the Volatility of GBP/JPY | GBP/JPY Forecast February 6, 2024
About author

Online


Add a comment
Comments
0 comments on the analysis GBP/JPY - 1H