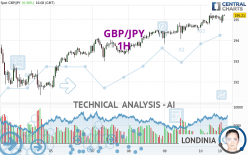
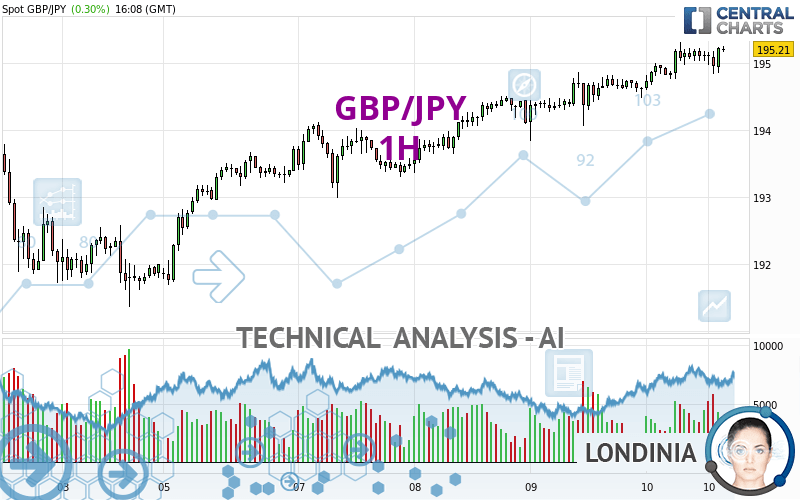
GBP/JPY - 1H - Technical analysis published on 05/10/2024 (GMT)
- 79
- 0
Click here for a new analysis!
- Timeframe : 1H
- - Analysis generated on
- Status : LEVEL MAINTAINED
Summary of the analysis

Additional analysis
Quotes
GBP/JPY rating 195.21 JPY. The price has increased by +0.30% since the last closing and was traded between 194.60 JPY and 195.32 JPY over the period. The price is currently at +0.31% from its lowest and -0.06% from its highest.A study of price movements over other periods shows the following variations:
Near a new HIGH record (5 years)
Type : Bullish
Timeframe : Weekly
Near a new HIGH record (1 year)
Type : Bullish
Timeframe : Weekly
Near a new HIGH record (1st january)
Type : Bullish
Timeframe : Weekly
Near a new HIGH record (1 month)
Type : Bullish
Timeframe : Weekly
Technical
Technical analysis of this 1H chart of GBP/JPY indicates that the overall trend is strongly bullish. 92.86% of the signals given by moving averages are bullish. This strongly bullish trend is supported by the strong bullish signals given by short-term moving averages. The Central Indicators scanner does not detect any result on moving averages that would impact this trend.
In fact, according to the parameters integrated into the Central Analyzer system, only 9 technical indicators out of 18 analysed are currently bullish. Caution: the Central Indicators scanner currently detects an excess:
Williams %R indicator is overbought : over -20
Type : Neutral
Timeframe : 1 hour
Pivot points : price is over resistance 1
Type : Neutral
Timeframe : 1 hour
Price is back over the pivot point
Type : Bullish
Timeframe : Weekly
An analysis of the price chart with the Central Patterns scanner (detector of chart patterns and resistances and supports) shows several results that can have an impact on the price change:
Near horizontal resistance
Type : Bearish
Timeframe : 1 hour
Resistance of channel is broken
Type : Bullish
Timeframe : 1 hour
The presence of these bearish patterns in Japanese candlesticks detected by Central Candlesticks that could cause a correction in the very short term were also noted
Bearish harami
Type : Bearish
Timeframe : 1 hour
Bearish harami cross
Type : Bearish
Timeframe : 1 hour
| S3 | S2 | S1 | Price | R1 | R2 | R3 | |
|---|---|---|---|---|---|---|---|
| ProTrendLines | 192.99 | 194.10 | 194.86 | 195.21 | 195.83 | 196.56 | 197.81 |
| Change (%) | -1.14% | -0.57% | -0.18% | - | +0.32% | +0.69% | +1.33% |
| Change | -2.22 | -1.11 | -0.35 | - | +0.62 | +1.35 | +2.60 |
| Level | Minor | Intermediate | Intermediate | - | Intermediate | Minor | Major |
Attention could also be paid to pivot points to set price objectives:
| Pivot points | S3 | S2 | S1 | PP | R1 | R2 | R3 |
|---|---|---|---|---|---|---|---|
| Standard | 192.99 | 193.42 | 194.02 | 194.45 | 195.05 | 195.48 | 196.08 |
| Camarilla | 194.35 | 194.44 | 194.54 | 194.63 | 194.72 | 194.82 | 194.91 |
| Woodie | 193.09 | 193.46 | 194.12 | 194.49 | 195.15 | 195.52 | 196.18 |
| Fibonacci | 193.42 | 193.81 | 194.05 | 194.45 | 194.84 | 195.08 | 195.48 |
| Pivot points | S3 | S2 | S1 | PP | R1 | R2 | R3 |
|---|---|---|---|---|---|---|---|
| Standard | 179.50 | 185.43 | 188.72 | 194.65 | 197.94 | 203.87 | 207.16 |
| Camarilla | 189.48 | 190.32 | 191.17 | 192.01 | 192.86 | 193.70 | 194.55 |
| Woodie | 178.18 | 184.77 | 187.40 | 193.99 | 196.62 | 203.21 | 205.84 |
| Fibonacci | 185.43 | 188.95 | 191.13 | 194.65 | 198.17 | 200.35 | 203.87 |
| Pivot points | S3 | S2 | S1 | PP | R1 | R2 | R3 |
|---|---|---|---|---|---|---|---|
| Standard | 180.56 | 185.27 | 191.15 | 195.86 | 201.74 | 206.45 | 212.33 |
| Camarilla | 194.11 | 195.08 | 196.05 | 197.02 | 197.99 | 198.96 | 199.93 |
| Woodie | 181.14 | 185.56 | 191.73 | 196.15 | 202.32 | 206.74 | 212.91 |
| Fibonacci | 185.27 | 189.32 | 191.82 | 195.86 | 199.91 | 202.41 | 206.45 |
Numerical data
The following are the details of the technical indicators and moving averages that were collected to generate this technical analysis:
| RSI (14): | 60.85 | |
| MACD (12,26,9): | 0.1500 | |
| Directional Movement: | 0.71 | |
| AROON (14): | 42.86 | |
| DEMA (21): | 195.17 | |
| Parabolic SAR (0,02-0,02-0,2): | 195.30 | |
| Elder Ray (13): | -0.02 | |
| Super Trend (3,10): | 194.53 | |
| Zig ZAG (10): | 195.20 | |
| VORTEX (21): | 1.0500 | |
| Stochastique (14,3,5): | 64.38 | |
| TEMA (21): | 195.18 | |
| Williams %R (14): | -17.86 | |
| Chande Momentum Oscillator (20): | 0.29 | |
| Repulse (5,40,3): | 0.1700 | |
| ROCnROLL: | 1 | |
| TRIX (15,9): | 0.0100 | |
| Courbe Coppock: | 0.36 |
| MA7: | 193.60 | |
| MA20: | 193.68 | |
| MA50: | 191.93 | |
| MA100: | 189.26 | |
| MAexp7: | 195.09 | |
| MAexp20: | 194.96 | |
| MAexp50: | 194.66 | |
| MAexp100: | 194.39 | |
| Price / MA7: | +0.83% | |
| Price / MA20: | +0.79% | |
| Price / MA50: | +1.71% | |
| Price / MA100: | +3.14% | |
| Price / MAexp7: | +0.06% | |
| Price / MAexp20: | +0.13% | |
| Price / MAexp50: | +0.28% | |
| Price / MAexp100: | +0.42% |
News
The last news published on GBP/JPY at the time of the generation of this analysis was as follows:
-
 Trading the trend: Time to go long GBP/JPY?
-
GBP/JPY Forecast May 3, 2024
-
GBP/JPY Forecast April 30, 2024
-
GBP/JPY Forecast April 25, 2024
-
GBP/JPY Forecast April 18, 2024
About author

Online


Add a comment
Comments
0 comments on the analysis GBP/JPY - 1H