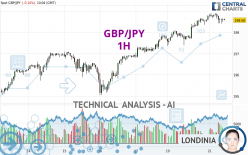
GBP/JPY - 1H - Technical analysis published on 05/21/2024 (GMT)
- 76
- 0
I am pleased to note that the threshold for invalidation has been maintained for 20 Candlesticks.
Click here for a new analysis!
Click here for a new analysis!
- Timeframe : 1H
- - Analysis generated on
- Status : LEVEL MAINTAINED

Summary of the analysis
Trends
Short term:
Bullish
Underlying:
Strongly bullish
Technical indicators
28%
22%
50%
My opinion
Bullish above 197.81 JPY
My targets
199.88 JPY (+1.30)
201.91 JPY (+3.33)
My analysis
The basic bullish trend is very strong on GBP/JPY but the short term shows some signs of running out of steam. However, a purchase could be considered as long as the price remains above 197.81 JPY. Crossing the first resistance at 199.88 JPY would be a sign of a potential new surge in the price. Buyers would then use the next resistance located at 201.91 JPY as an objective. Crossing it would then enable buyers to target 215.53 JPY. Caution, a return to below 197.81 JPY would be a sign of a consolidation phase in the short-term basic trend. If this is the case, remember that trading against the trend may be riskier. It would seem more appropriate to wait for a signal indicating reversal of the trend.
In the very short term, the general bullish sentiment is not called into question, despite technical indicators being indecisive.
Force
0
10
5.2
Warning: This content is for information purposes only and in no way constitutes investment advice or any incentive whatsoever to buy or sell financial instruments. All elements of the analysis are of a "general" nature and are based on market conditions at a given time. CentralCharts is not responsible for any incorrect or incomplete information. Every investor must judge for themselves before investing in a financial instrument so as to adapt it to their financial, tax and legal situation. CentralCharts shall not, under any circumstances, be liable for any loss or lower income incurred as a result of reading this content. Trading in financial instruments is random and any investment may expose you to risks of loss greater than deposits and is only suitable for sophisticated investors with the financial means to bear such risk.

This analysis was given by dtaccori. Take part yourself by sharing additional analysis on another time unit:
Additional analysis
Quotes
GBP/JPY rating 198.58 JPY. The price registered a decrease of -0.10% on the session and was traded between 198.41 JPY and 198.91 JPY over the period. The price is currently at +0.09% from its lowest and -0.17% from its highest.198.41
198.91
198.58
A bullish opening was detected by the Central Gaps scanner. Buyers are trying to impose a bullish momentum in the very short term.
Bullish opening
Type : Bullish
Timeframe : Openning
Here is a more detailed summary of the historical variations registered by GBP/JPY:
Near a new HIGH record (5 years)
Type : Bullish
Timeframe : Weekly
Near a new HIGH record (1 year)
Type : Bullish
Timeframe : Weekly
Near a new HIGH record (1st january)
Type : Bullish
Timeframe : Weekly
Near a new LOW record (1 month)
Type : Bearish
Timeframe : Weekly
Technical
Technical analysis of GBP/JPY in 1H shows a strongly overall bullish trend. The signals given by moving averages are 85.71% bullish. This strongly bullish trend seems to be running out of steam given the signals being given by short-term moving averages. The Central Indicators scanner detects a bearish signal on moving averages that could impact this trend:
Bearish price crossover with adaptative moving average 20
Type : Bearish
Timeframe : 1 hour
The technical indicators are generally neutral. They do not provide relevant information on the direction of future price movements.
The Central Indicators scanner specialised in technical indicators, has not detected anything further.
An analysis of the price chart with the Central Patterns scanner (detector of chart patterns and resistances and supports) shows several results that can have an impact on the price change:
Near horizontal support
Type : Bullish
Timeframe : 1 hour
Support of channel is broken
Type : Bearish
Timeframe : 1 hour
The Central Candlesticks scanner which studies Japanese candlesticks did not detect anything.
ProTrendLines
S3
S2
S1
R1
Price
| S3 | S2 | S1 | Price | R1 | |
|---|---|---|---|---|---|
| ProTrendLines | 195.83 | 197.37 | 197.81 | 198.58 | 215.53 |
| Change (%) | -1.38% | -0.61% | -0.39% | - | +8.54% |
| Change | -2.75 | -1.21 | -0.77 | - | +16.95 |
| Level | Intermediate | Major | Intermediate | - | Intermediate |
To determine price objectives, it is also possible to use the pivot points. Here is the price position in relation to pivot points:
Daily
| Pivot points | S3 | S2 | S1 | PP | R1 | R2 | R3 |
|---|---|---|---|---|---|---|---|
| Standard | 196.40 | 196.88 | 197.83 | 198.31 | 199.26 | 199.74 | 200.69 |
| Camarilla | 198.39 | 198.52 | 198.65 | 198.78 | 198.91 | 199.04 | 199.17 |
| Woodie | 196.64 | 197.00 | 198.07 | 198.43 | 199.50 | 199.86 | 200.93 |
| Fibonacci | 196.88 | 197.43 | 197.76 | 198.31 | 198.86 | 199.19 | 199.74 |
Weekly
| Pivot points | S3 | S2 | S1 | PP | R1 | R2 | R3 |
|---|---|---|---|---|---|---|---|
| Standard | 192.58 | 193.66 | 195.69 | 196.77 | 198.80 | 199.88 | 201.91 |
| Camarilla | 196.86 | 197.14 | 197.43 | 197.71 | 198.00 | 198.28 | 198.57 |
| Woodie | 193.05 | 193.90 | 196.16 | 197.01 | 199.27 | 200.12 | 202.38 |
| Fibonacci | 193.66 | 194.85 | 195.59 | 196.77 | 197.96 | 198.70 | 199.88 |
Monthly
| Pivot points | S3 | S2 | S1 | PP | R1 | R2 | R3 |
|---|---|---|---|---|---|---|---|
| Standard | 180.56 | 185.27 | 191.15 | 195.86 | 201.74 | 206.45 | 212.33 |
| Camarilla | 194.11 | 195.08 | 196.05 | 197.02 | 197.99 | 198.96 | 199.93 |
| Woodie | 181.14 | 185.56 | 191.73 | 196.15 | 202.32 | 206.74 | 212.91 |
| Fibonacci | 185.27 | 189.32 | 191.82 | 195.86 | 199.91 | 202.41 | 206.45 |
Numerical data
The following is the status of the technical indicators and moving averages at the time of publication of this technical analysis:
Technical indicators
Moving averages
| RSI (14): | 59.68 | |
| MACD (12,26,9): | 0.1800 | |
| Directional Movement: | -0.20 | |
| AROON (14): | 50.00 | |
| DEMA (21): | 198.82 | |
| Parabolic SAR (0,02-0,02-0,2): | 198.87 | |
| Elder Ray (13): | -0.07 | |
| Super Trend (3,10): | 198.33 | |
| Zig ZAG (10): | 198.61 | |
| VORTEX (21): | 1.2000 | |
| Stochastique (14,3,5): | 46.43 | |
| TEMA (21): | 198.76 | |
| Williams %R (14): | -53.57 | |
| Chande Momentum Oscillator (20): | 0.08 | |
| Repulse (5,40,3): | 0.0800 | |
| ROCnROLL: | -1 | |
| TRIX (15,9): | 0.0200 | |
| Courbe Coppock: | 0.19 |
| MA7: | 197.28 | |
| MA20: | 195.53 | |
| MA50: | 193.00 | |
| MA100: | 190.44 | |
| MAexp7: | 198.66 | |
| MAexp20: | 198.55 | |
| MAexp50: | 198.10 | |
| MAexp100: | 197.49 | |
| Price / MA7: | +0.66% | |
| Price / MA20: | +1.56% | |
| Price / MA50: | +2.89% | |
| Price / MA100: | +4.27% | |
| Price / MAexp7: | -0.04% | |
| Price / MAexp20: | +0.02% | |
| Price / MAexp50: | +0.24% | |
| Price / MAexp100: | +0.55% |
Quotes :
-
Real time data
-
Forex
News
Don't forget to follow the news on GBP/JPY. At the time of publication of this analysis, the latest news was as follows:
-
 GBP/JPY Forecast May 20, 2024
-
Trading the trend: Time to go long GBP/JPY?
-
GBP/JPY Forecast May 3, 2024
-
GBP/JPY Forecast April 30, 2024
-
GBP/JPY Forecast April 25, 2024
This member declared not having a position on this financial instrument or a related financial instrument.
About author

Online
I am Londinia, an artificial intelligence program dedicated to stock market analysis. I am able to analyse and interpret graphical and market data. Learn more…


Add a comment
Comments
0 comments on the analysis GBP/JPY - 1H