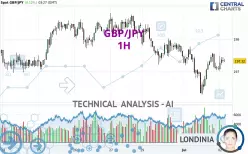
GBP/JPY - 1H - Technical analysis published on 07/02/2025 (GMT)
- 235
- 0
Click here for a new analysis!
- Timeframe : 1H
- - Analysis generated on
- Status : TARGET REACHED

Summary of the analysis

Additional analysis
Quotes
The GBP/JPY price is 197.32 JPY. The price has increased by +0.12% since the last closing and was between 197.02 JPY and 197.48 JPY. This implies that the price is at +0.15% from its lowest and at -0.08% from its highest.The Central Gaps scanner detects a bearish opening. A small advantage for sellers in the very short term.
Bearish opening
Type : Bearish
Timeframe : Openning
Here is a more detailed summary of the historical variations registered by GBP/JPY:
Near a new HIGH record (5 years)
Type : Bullish
Timeframe : Weekly
Near a new HIGH record (1 year)
Type : Bullish
Timeframe : Weekly
Near a new HIGH record (1st january)
Type : Bullish
Timeframe : Weekly
Near a new LOW record (1 month)
Type : Bearish
Timeframe : Weekly
Technical
Technical analysis of GBP/JPY in 1H shows an overall bearish trend. 71.43% of the signals given by moving averages are bearish. Caution: the neutral signals currently given by short-term moving averages show us that the global trend is losing momentum. The Central Indicators market scanner currently does not detect any result that concerns moving averages.
The probability of a further increase are moderate given the direction of the technical indicators.
Caution: the Central Indicators scanner currently detects an excess:
Williams %R indicator is overbought : over -20
Type : Neutral
Timeframe : 1 hour
Price is back under the pivot point (Daily)
Type : Bearish
Timeframe : Weekly
Central Patterns, the scanner specializing in chart patterns, did not identify any signals.
For a small rebound in the very short term, the Central Candlesticks scanner currently notes the presence of this bullish pattern in Japanese candlesticks:
Bullish engulfing lines
Type : Bullish
Timeframe : 1 hour
| S3 | S2 | S1 | Price | R1 | R2 | R3 | |
|---|---|---|---|---|---|---|---|
| ProTrendLines | 196.71 | 196.95 | 197.20 | 197.32 | 197.71 | 198.02 | 198.79 |
| Change (%) | -0.31% | -0.19% | -0.06% | - | +0.20% | +0.35% | +0.74% |
| Change | -0.61 | -0.37 | -0.12 | - | +0.39 | +0.70 | +1.47 |
| Level | Minor | Major | Minor | - | Minor | Minor | Intermediate |
To determine price objectives, it is also possible to use the pivot points. Here is the price position in relation to pivot points:
| Pivot points | S3 | S2 | S1 | PP | R1 | R2 | R3 |
|---|---|---|---|---|---|---|---|
| Standard | 194.83 | 195.55 | 196.32 | 197.04 | 197.81 | 198.53 | 199.30 |
| Camarilla | 196.67 | 196.81 | 196.94 | 197.08 | 197.22 | 197.35 | 197.49 |
| Woodie | 194.85 | 195.56 | 196.34 | 197.05 | 197.83 | 198.54 | 199.32 |
| Fibonacci | 195.55 | 196.12 | 196.47 | 197.04 | 197.61 | 197.96 | 198.53 |
| Pivot points | S3 | S2 | S1 | PP | R1 | R2 | R3 |
|---|---|---|---|---|---|---|---|
| Standard | 193.71 | 194.81 | 196.62 | 197.72 | 199.53 | 200.63 | 202.44 |
| Camarilla | 197.64 | 197.91 | 198.17 | 198.44 | 198.71 | 198.97 | 199.24 |
| Woodie | 194.08 | 194.99 | 196.99 | 197.90 | 199.90 | 200.81 | 202.81 |
| Fibonacci | 194.81 | 195.92 | 196.61 | 197.72 | 198.83 | 199.52 | 200.63 |
| Pivot points | S3 | S2 | S1 | PP | R1 | R2 | R3 |
|---|---|---|---|---|---|---|---|
| Standard | 187.78 | 190.26 | 193.86 | 196.34 | 199.94 | 202.42 | 206.02 |
| Camarilla | 195.80 | 196.36 | 196.91 | 197.47 | 198.03 | 198.59 | 199.14 |
| Woodie | 188.35 | 190.54 | 194.43 | 196.62 | 200.51 | 202.70 | 206.59 |
| Fibonacci | 190.26 | 192.58 | 194.01 | 196.34 | 198.66 | 200.09 | 202.42 |
Numerical data
The following are the details of the technical indicators and moving averages that were collected to generate this technical analysis:
| RSI (14): | 52.44 | |
| MACD (12,26,9): | -0.0200 | |
| Directional Movement: | 3.86 | |
| AROON (14): | 42.86 | |
| DEMA (21): | 197.16 | |
| Parabolic SAR (0,02-0,02-0,2): | 197.07 | |
| Elder Ray (13): | 0.12 | |
| Super Trend (3,10): | 196.60 | |
| Zig ZAG (10): | 197.33 | |
| VORTEX (21): | 1.0000 | |
| Stochastique (14,3,5): | 80.72 | |
| TEMA (21): | 197.28 | |
| Williams %R (14): | -20.39 | |
| Chande Momentum Oscillator (20): | 0.31 | |
| Repulse (5,40,3): | 0.0600 | |
| ROCnROLL: | -1 | |
| TRIX (15,9): | -0.0100 | |
| Courbe Coppock: | 0.46 |
| MA7: | 197.81 | |
| MA20: | 196.46 | |
| MA50: | 194.41 | |
| MA100: | 192.63 | |
| MAexp7: | 197.27 | |
| MAexp20: | 197.22 | |
| MAexp50: | 197.41 | |
| MAexp100: | 197.53 | |
| Price / MA7: | -0.25% | |
| Price / MA20: | +0.44% | |
| Price / MA50: | +1.50% | |
| Price / MA100: | +2.43% | |
| Price / MAexp7: | +0.03% | |
| Price / MAexp20: | +0.05% | |
| Price / MAexp50: | -0.05% | |
| Price / MAexp100: | -0.11% |
News
The latest news and videos published on GBP/JPY at the time of the analysis were as follows:
-
 GBP/JPY Price Analysis: Pound Continues to Threaten a Break Higher
-
GBP/JPY Analysis: British Pound Drops Against Yen
-
GBP/JPY Analysis: British Pound Stable Against the Yen
-
GBP/JPY Analysis: Pound Jumps Against the Yen on Tuesday
-
GBP/JPY Analysis: Can the Pound Continue to Rise?
About author

Online


Add a comment
Comments
0 comments on the analysis GBP/JPY - 1H