BED BATH & BEYOND INC. - Daily - Technical analysis published on 04/03/2023 (GMT)
- 99
- 0
- Timeframe : Daily
- - Analysis generated on
- Status : WITHOUT TARGET

Summary of the analysis
Additional analysis
Quotes
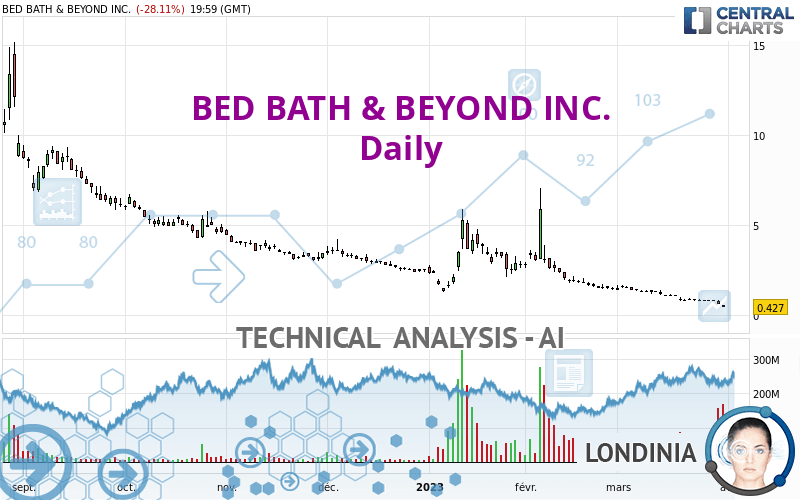
BED BATH & BEYOND INC. rating 0.427 USD. On the day, this instrument lost -28.11% with the lowest point at 0.420 USD and the highest point at 0.550 USD. The deviation from the price is +1.67% for the low point and -22.36% for the high point.The Central Gaps scanner detects a bearish gap which is a sign that the sellers have taken the lead in the very short term.
Opening Gap DOWN
Type : Bearish
Timeframe : Openning
Here is a more detailed summary of the historical variations registered by BED BATH & BEYOND INC.:
New LOW record (5 years)
Type : Bearish
Timeframe : Weekly
New LOW record (1 year)
Type : Bearish
Timeframe : Weekly
New LOW record (1st january)
Type : Bearish
Timeframe : Weekly
New LOW record (1 month)
Type : Bearish
Timeframe : Weekly
The Central Volumes scanner detects abnormal volumes on the asset:
Abnormal volumes
Timeframe : 5 days
Abnormal volumes
Timeframe : 50 days
Technical
Technical analysis of BED BATH & BEYOND INC. in Daily shows a overall strongly bearish trend. The signals given by moving averages are 92.86% bearish. This strong bearish trend is confirmed by the strong signals currently being given by short-term moving averages. The Central Indicators market scanner currently does not detect any result that concerns moving averages.
An assessment of technical indicators shows a bearish signal.
Caution: the Central Indicators scanner currently detects an excess:
RSI indicator is oversold : under 30
Type : Neutral
Timeframe : Daily
CCI indicator is oversold : under -100
Type : Neutral
Timeframe : Daily
Williams %R indicator is oversold : under -80
Type : Neutral
Timeframe : Daily
Pivot points : price is under support 3
Type : Neutral
Timeframe : Daily
Pivot points : price is under support 3
Type : Neutral
Timeframe : Weekly
The analysis of the price chart with Central Patterns scanners does not return any result.
For a small setback in the very short term, the Central Candlesticks scanner currently notes the presence of this bearish pattern in Japanese candlesticks:
Downside gap
Type : Bearish
Timeframe : Daily
| Price | R1 | R2 | R3 | |
|---|---|---|---|---|
| ProTrendLines | 0.427 | 2.520 | 7.181 | 13.350 |
| Change (%) | - | +490.16% | +1,581.73% | +3,026.46% |
| Change | - | +2.093 | +6.754 | +12.923 |
| Level | - | Minor | Intermediate | Minor |
To determine price objectives, it is also possible to use the pivot points. Here is the price position in relation to pivot points:
| Pivot points | S3 | S2 | S1 | PP | R1 | R2 | R3 |
|---|---|---|---|---|---|---|---|
| Standard | 0.251 | 0.336 | 0.381 | 0.466 | 0.511 | 0.596 | 0.641 |
| Camarilla | 0.391 | 0.403 | 0.415 | 0.427 | 0.439 | 0.451 | 0.463 |
| Woodie | 0.232 | 0.326 | 0.362 | 0.456 | 0.492 | 0.586 | 0.622 |
| Fibonacci | 0.336 | 0.385 | 0.416 | 0.466 | 0.515 | 0.546 | 0.596 |
| Pivot points | S3 | S2 | S1 | PP | R1 | R2 | R3 |
|---|---|---|---|---|---|---|---|
| Standard | 0.542 | 0.655 | 0.735 | 0.848 | 0.928 | 1.041 | 1.121 |
| Camarilla | 0.763 | 0.781 | 0.798 | 0.816 | 0.834 | 0.851 | 0.869 |
| Woodie | 0.527 | 0.647 | 0.720 | 0.840 | 0.913 | 1.033 | 1.106 |
| Fibonacci | 0.655 | 0.728 | 0.774 | 0.848 | 0.921 | 0.967 | 1.041 |
| Pivot points | S3 | S2 | S1 | PP | R1 | R2 | R3 |
|---|---|---|---|---|---|---|---|
| Standard | -6.167 | -2.403 | -0.497 | 3.267 | 5.173 | 8.937 | 10.843 |
| Camarilla | -0.149 | 0.371 | 0.890 | 1.410 | 1.930 | 2.450 | 2.969 |
| Woodie | -7.095 | -2.868 | -1.425 | 2.803 | 4.245 | 8.473 | 9.915 |
| Fibonacci | -2.403 | -0.237 | 1.101 | 3.267 | 5.433 | 6.771 | 8.937 |
Numerical data
The following is the status of technical indicators and moving averages registered at the time this technical analysis was created:
| RSI (14): | 26.16 | |
| MACD (12,26,9): | -0.3330 | |
| Directional Movement: | -16.071 | |
| AROON (14): | -92.857 | |
| DEMA (21): | 0.532 | |
| Parabolic SAR (0,02-0,02-0,2): | 0.810 | |
| Elder Ray (13): | -0.340 | |
| Super Trend (3,10): | 0.943 | |
| Zig ZAG (10): | 0.427 | |
| VORTEX (21): | 0.5990 | |
| Stochastique (14,3,5): | 2.49 | |
| TEMA (21): | 0.528 | |
| Williams %R (14): | -99.24 | |
| Chande Momentum Oscillator (20): | -0.603 | |
| Repulse (5,40,3): | -69.0950 | |
| ROCnROLL: | 2 | |
| TRIX (15,9): | -3.1330 | |
| Courbe Coppock: | 89.51 |
| MA7: | 0.715 | |
| MA20: | 0.978 | |
| MA50: | 1.842 | |
| MA100: | 2.492 | |
| MAexp7: | 0.687 | |
| MAexp20: | 0.992 | |
| MAexp50: | 1.665 | |
| MAexp100: | 2.786 | |
| Price / MA7: | -40.28% | |
| Price / MA20: | -56.34% | |
| Price / MA50: | -76.82% | |
| Price / MA100: | -82.87% | |
| Price / MAexp7: | -37.85% | |
| Price / MAexp20: | -56.96% | |
| Price / MAexp50: | -74.35% | |
| Price / MAexp100: | -84.67% |
News
The latest news and videos published on BED BATH & BEYOND INC. at the time of the analysis were as follows:
- Find Everything You Need for Spring Gatherings and Celebrations at Bed Bath & Beyond® and buybuy BABY®
- Bed Bath & Beyond Inc. Enters into Committed Equity Facility for Additional Funding
- Bed Bath & Beyond Inc. Launches New $300 Million At-the-Market Offering Program
- Make Spring Cleaning a Breeze with Must-Have Products from Bed Bath & Beyond®
- Bed Bath & Beyond Inc. Announces Special Shareholder Meeting to Approve Reverse Stock Split
About author

Online


Add a comment
Comments
0 comments on the analysis BED BATH & BEYOND INC. - Daily