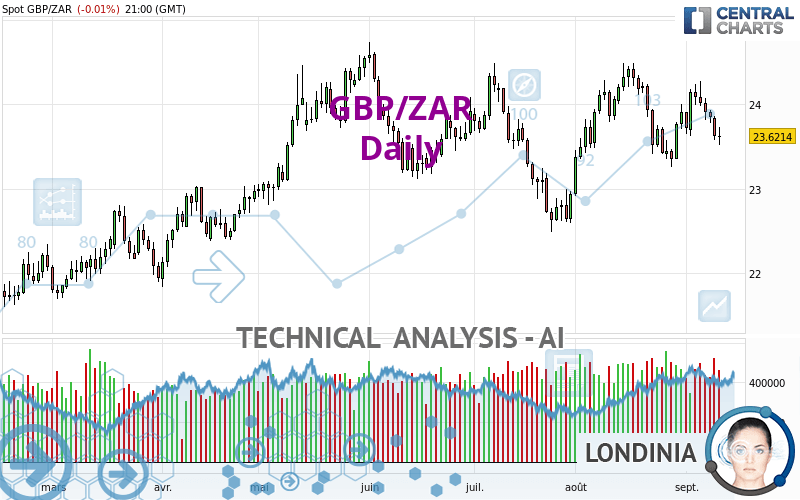
GBP/ZAR - Daily - Technical analysis published on 09/12/2023 (GMT)
- 118
- 0
Click here for a new analysis!
- Timeframe : Daily
- - Analysis generated on
- Status : TARGET REACHED

Summary of the analysis

Additional analysis
Quotes
The GBP/ZAR price is 23.6214 ZAR. On the day, this instrument lost -0.01% and was traded between 23.5189 ZAR and 23.7366 ZAR over the period. The price is currently at +0.44% from its lowest and -0.49% from its highest.The Central Gaps scanner detects a bearish opening marking the presence of sellers ahead of buyers at the opening but not sufficiently marked to allow the price to register a quotation gap.
Bearish opening
Type : Bearish
Timeframe : Openning
Here is a more detailed summary of the historical variations registered by GBP/ZAR:
Near a new HIGH record (5 years)
Type : Bullish
Timeframe : Weekly
Near a new HIGH record (1 year)
Type : Bullish
Timeframe : Weekly
Near a new HIGH record (1st january)
Type : Bullish
Timeframe : Weekly
Near a new HIGH record (1 month)
Type : Bullish
Timeframe : Weekly
Technical
A technical analysis in Daily of this GBP/ZAR chart shows a neutral trend. The trend could quickly turn bearish due to the strong bearish signals currently being given by short-term moving averages. The Central Indicators scanner detects bearish signals on moving averages that could impact this trend:
Bearish trend reversal : adaptative moving average 20
Type : Bearish
Timeframe : Daily
Bearish trend reversal : adaptative moving average 50
Type : Bearish
Timeframe : Daily
An assessment of technical indicators does not currently provide any relevant information on the direction of future price movements.
Central Indicators, the detector scanner for these technical indicators has recently detected several signals:
Parabolic SAR indicator bearish reversal
Type : Bearish
Timeframe : Daily
Ichimoku - Bullish crossover : Tenkan & Kijun
Type : Bullish
Timeframe : Daily
Momentum indicator is back over 0
Type : Bullish
Timeframe : Daily
An analysis of the price chart with the Central Patterns scanner (detector of chart patterns and resistances and supports) shows several results that can have an impact on the price change:
Near horizontal support
Type : Bullish
Timeframe : Daily
Near support of channel
Type : Bullish
Timeframe : Daily
The Central Candlesticks scanner which studies Japanese candlesticks did not detect anything.
| S3 | S2 | S1 | Price | R1 | R2 | |
|---|---|---|---|---|---|---|
| ProTrendLines | 22.6326 | 23.2072 | 23.6066 | 23.6214 | 24.1493 | 24.5070 |
| Change (%) | -4.19% | -1.75% | -0.06% | - | +2.23% | +3.75% |
| Change | -0.9888 | -0.4142 | -0.0148 | - | +0.5279 | +0.8856 |
| Level | Intermediate | Intermediate | Major | - | Minor | Major |
Pivot points can also be used to set your price objectives. Here is the price situation in relation to pivot points:
| Pivot points | S3 | S2 | S1 | PP | R1 | R2 | R3 |
|---|---|---|---|---|---|---|---|
| Standard | 23.2304 | 23.4060 | 23.5153 | 23.6909 | 23.8002 | 23.9758 | 24.0851 |
| Camarilla | 23.5462 | 23.5723 | 23.5984 | 23.6245 | 23.6506 | 23.6767 | 23.7029 |
| Woodie | 23.1972 | 23.3894 | 23.4821 | 23.6743 | 23.7670 | 23.9592 | 24.0519 |
| Fibonacci | 23.4060 | 23.5149 | 23.5821 | 23.6909 | 23.7998 | 23.8670 | 23.9758 |
| Pivot points | S3 | S2 | S1 | PP | R1 | R2 | R3 |
|---|---|---|---|---|---|---|---|
| Standard | 22.9140 | 23.2714 | 23.5625 | 23.9199 | 24.2110 | 24.5684 | 24.8595 |
| Camarilla | 23.6752 | 23.7346 | 23.7941 | 23.8535 | 23.9130 | 23.9724 | 24.0318 |
| Woodie | 22.8808 | 23.2548 | 23.5293 | 23.9033 | 24.1778 | 24.5518 | 24.8263 |
| Fibonacci | 23.2714 | 23.5192 | 23.6722 | 23.9199 | 24.1677 | 24.3207 | 24.5684 |
| Pivot points | S3 | S2 | S1 | PP | R1 | R2 | R3 |
|---|---|---|---|---|---|---|---|
| Standard | 21.4692 | 22.1930 | 23.0494 | 23.7732 | 24.6296 | 25.3534 | 26.2098 |
| Camarilla | 23.4714 | 23.6162 | 23.7611 | 23.9059 | 24.0508 | 24.1956 | 24.3405 |
| Woodie | 21.5356 | 22.2262 | 23.1158 | 23.8064 | 24.6960 | 25.3866 | 26.2762 |
| Fibonacci | 22.1930 | 22.7966 | 23.1695 | 23.7732 | 24.3768 | 24.7497 | 25.3534 |
Numerical data
The following are the details of the technical indicators and moving averages that were collected to generate this technical analysis:
| RSI (14): | 46.37 | |
| MACD (12,26,9): | 0.0162 | |
| Directional Movement: | -2.8527 | |
| AROON (14): | 42.8572 | |
| DEMA (21): | 23.8449 | |
| Parabolic SAR (0,02-0,02-0,2): | 24.2774 | |
| Elder Ray (13): | -0.1818 | |
| Super Trend (3,10): | 24.2550 | |
| Zig ZAG (10): | 23.6369 | |
| VORTEX (21): | 0.9215 | |
| Stochastique (14,3,5): | 43.64 | |
| TEMA (21): | 23.8070 | |
| Williams %R (14): | -63.07 | |
| Chande Momentum Oscillator (20): | 0.2089 | |
| Repulse (5,40,3): | -0.8958 | |
| ROCnROLL: | 2 | |
| TRIX (15,9): | 0.0317 | |
| Courbe Coppock: | 0.61 |
| MA7: | 23.8962 | |
| MA20: | 23.8591 | |
| MA50: | 23.6801 | |
| MA100: | 23.6781 | |
| MAexp7: | 23.7832 | |
| MAexp20: | 23.8055 | |
| MAexp50: | 23.7178 | |
| MAexp100: | 23.4480 | |
| Price / MA7: | -1.15% | |
| Price / MA20: | -1.00% | |
| Price / MA50: | -0.25% | |
| Price / MA100: | -0.24% | |
| Price / MAexp7: | -0.68% | |
| Price / MAexp20: | -0.77% | |
| Price / MAexp50: | -0.41% | |
| Price / MAexp100: | +0.74% |
About author
Online


Add a comment
Comments
0 comments on the analysis GBP/ZAR - Daily