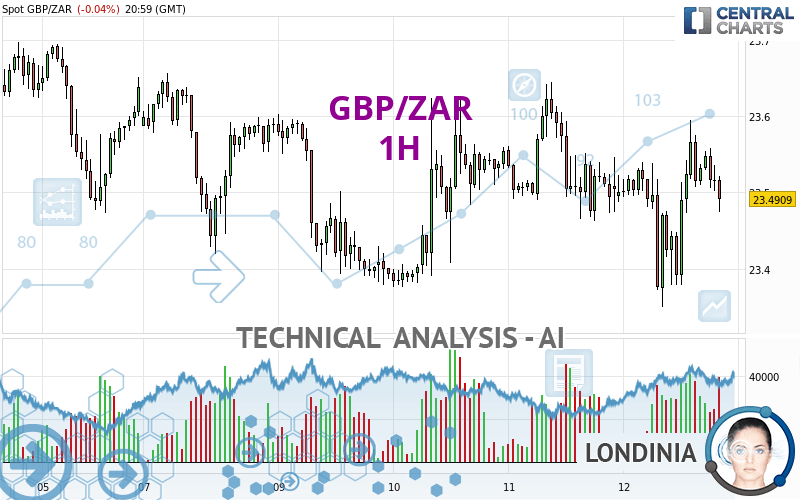
GBP/ZAR - 1H - Technical analysis published on 04/12/2024 (GMT)
- 93
- 0
Click here for a new analysis!
- Timeframe : 1H
- - Analysis generated on
- Status : INVALID
Summary of the analysis

Additional analysis
Quotes
The GBP/ZAR rating is 23.4909 ZAR. On the day, this instrument lost -0.04% with the lowest point at 23.3499 ZAR and the highest point at 23.5945 ZAR. The deviation from the price is +0.60% for the low point and -0.44% for the high point.The Central Gaps scanner detects a bearish opening. A small advantage for sellers in the very short term.
Bearish opening
Type : Bearish
Timeframe : Openning
So that you have an overall view of the price change, here is a table showing the variations over several periods:
Near a new HIGH record (5 years)
Type : Bullish
Timeframe : Weekly
Near a new HIGH record (1 year)
Type : Bullish
Timeframe : Weekly
Near a new HIGH record (1st january)
Type : Bullish
Timeframe : Weekly
New LOW record (1st january)
Type : Bearish
Timeframe : Weekly
Near a new HIGH record (1 month)
Type : Bullish
Timeframe : Weekly
New LOW record (1 month)
Type : Bearish
Timeframe : Weekly
Technical
Technical analysis of GBP/ZAR in 1H shows a overall strongly bearish trend. The signals given by moving averages are 89.29% bearish. This strong bearish trend is confirmed by the strong signals currently being given by short-term moving averages. The Central Indicators market scanner is currently detecting several bearish signals that could impact this trend:
Bearish trend reversal : Moving Average 50
Type : Bearish
Timeframe : 1 hour
Bearish price crossover with Moving Average 20
Type : Bearish
Timeframe : 1 hour
Bearish price crossover with Moving Average 100
Type : Bearish
Timeframe : 1 hour
Bearish price crossover with adaptative moving average 20
Type : Bearish
Timeframe : 1 hour
Bearish price crossover with adaptative moving average 50
Type : Bearish
Timeframe : 1 hour
Bearish price crossover with adaptative moving average 100
Type : Bearish
Timeframe : 1 hour
The technical indicators are generally neutral. They do not provide relevant information on the direction of future price movements.
Central Indicators, the scanner specialised in technical indicators, has identified these signals:
RSI indicator is back under 50
Type : Bearish
Timeframe : 1 hour
Ichimoku : price is under the cloud
Type : Bearish
Timeframe : 1 hour
An analysis of the price chart with the Central Patterns scanner (detector of chart patterns and resistances and supports) shows several results that can have an impact on the price change:
Near horizontal resistance
Type : Bearish
Timeframe : 1 hour
Resistance of channel is broken
Type : Bullish
Timeframe : 1 hour
The presence of a bearish pattern in Japanese candlesticks detected by Central Candlesticks that could cause a correction in the very short term was also detected:
Bearish engulfing lines
Type : Bearish
Timeframe : 1 hour
| S3 | S2 | S1 | Price | R1 | R2 | R3 | |
|---|---|---|---|---|---|---|---|
| ProTrendLines | 23.3546 | 23.4193 | 23.4725 | 23.4909 | 23.5111 | 23.5674 | 23.6732 |
| Change (%) | -0.58% | -0.30% | -0.08% | - | +0.09% | +0.33% | +0.78% |
| Change | -0.1363 | -0.0716 | -0.0184 | - | +0.0202 | +0.0765 | +0.1823 |
| Level | Intermediate | Minor | Minor | - | Minor | Intermediate | Major |
Pivot points can also be used to set your price objectives. Here is the price situation in relation to pivot points:
| Pivot points | S3 | S2 | S1 | PP | R1 | R2 | R3 |
|---|---|---|---|---|---|---|---|
| Standard | 23.2459 | 23.3542 | 23.4276 | 23.5359 | 23.6093 | 23.7176 | 23.7910 |
| Camarilla | 23.4511 | 23.4678 | 23.4844 | 23.5011 | 23.5178 | 23.5344 | 23.5511 |
| Woodie | 23.2286 | 23.3455 | 23.4103 | 23.5272 | 23.5920 | 23.7089 | 23.7737 |
| Fibonacci | 23.3542 | 23.4236 | 23.4665 | 23.5359 | 23.6053 | 23.6482 | 23.7176 |
| Pivot points | S3 | S2 | S1 | PP | R1 | R2 | R3 |
|---|---|---|---|---|---|---|---|
| Standard | 22.8474 | 23.1600 | 23.3990 | 23.7116 | 23.9506 | 24.2632 | 24.5022 |
| Camarilla | 23.4864 | 23.5370 | 23.5875 | 23.6381 | 23.6887 | 23.7392 | 23.7898 |
| Woodie | 22.8107 | 23.1416 | 23.3623 | 23.6932 | 23.9139 | 24.2448 | 24.4655 |
| Fibonacci | 23.1600 | 23.3707 | 23.5009 | 23.7116 | 23.9223 | 24.0525 | 24.2632 |
| Pivot points | S3 | S2 | S1 | PP | R1 | R2 | R3 |
|---|---|---|---|---|---|---|---|
| Standard | 22.9390 | 23.3200 | 23.5486 | 23.9296 | 24.1582 | 24.5392 | 24.7678 |
| Camarilla | 23.6095 | 23.6653 | 23.7212 | 23.7771 | 23.8330 | 23.8889 | 23.9447 |
| Woodie | 22.8627 | 23.2819 | 23.4723 | 23.8915 | 24.0819 | 24.5011 | 24.6915 |
| Fibonacci | 23.3200 | 23.5529 | 23.6968 | 23.9296 | 24.1625 | 24.3064 | 24.5392 |
Numerical data
The following is the status of the technical indicators and moving averages at the time of publication of this technical analysis:
| RSI (14): | 48.55 | |
| MACD (12,26,9): | 0.0030 | |
| Directional Movement: | -2.8460 | |
| AROON (14): | 42.8572 | |
| DEMA (21): | 23.5037 | |
| Parabolic SAR (0,02-0,02-0,2): | 23.4332 | |
| Elder Ray (13): | -0.0068 | |
| Super Trend (3,10): | 23.5918 | |
| Zig ZAG (10): | 23.4909 | |
| VORTEX (21): | 0.9894 | |
| Stochastique (14,3,5): | 64.51 | |
| TEMA (21): | 23.5107 | |
| Williams %R (14): | -42.35 | |
| Chande Momentum Oscillator (20): | 0.0208 | |
| Repulse (5,40,3): | -0.1600 | |
| ROCnROLL: | 2 | |
| TRIX (15,9): | -0.0022 | |
| Courbe Coppock: | 0.27 |
| MA7: | 23.5444 | |
| MA20: | 23.7565 | |
| MA50: | 23.9156 | |
| MA100: | 23.8261 | |
| MAexp7: | 23.5105 | |
| MAexp20: | 23.5028 | |
| MAexp50: | 23.5050 | |
| MAexp100: | 23.5196 | |
| Price / MA7: | -0.23% | |
| Price / MA20: | -1.12% | |
| Price / MA50: | -1.78% | |
| Price / MA100: | -1.41% | |
| Price / MAexp7: | -0.08% | |
| Price / MAexp20: | -0.05% | |
| Price / MAexp50: | -0.06% | |
| Price / MAexp100: | -0.12% |
About author
Online


Add a comment
Comments
0 comments on the analysis GBP/ZAR - 1H