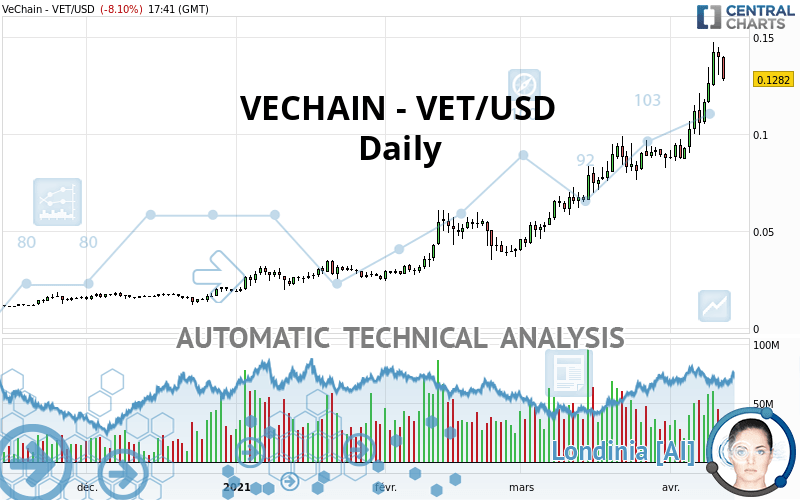
VECHAIN - VET/USD - Daily - Technical analysis published on 04/12/2021 (GMT)
- 263
- 0
Click here for a new analysis!
- Timeframe : Daily
- - Analysis generated on
- Status : TARGET REACHED

Summary of the analysis

Additional analysis
Quotes
The VECHAIN - VET/USD price is 0.128200 USD. The price is lower by -8.10% since the last closing and was traded between 0.127200 USD and 0.140300 USD over the period. The price is currently at +0.79% from its lowest and -8.62% from its highest.The Central Gaps scanner detects a bullish opening marking the presence of buyers ahead of sellers at the opening but not sufficiently marked to allow the price to register a quotation gap.
Bullish opening
Type : Bullish
Timeframe : Openning
So that you have an overall view of the price change, here is a table showing the variations over several periods:
Technical
Technical analysis of VECHAIN - VET/USD in Daily shows a strongly overall bullish trend. 92.86% of the signals given by moving averages are bullish. The overall trend is supported by the strong bullish signals from short-term moving averages. The Central Indicators market scanner currently does not detect any result that concerns moving averages.
The probability of a further increase is high given the direction of the technical indicators.
Caution: the Central Indicators scanner currently detects an excess:
RSI indicator is overbought : over 70
Type : Neutral
Timeframe : Daily
CCI indicator is overbought : over 100
Type : Neutral
Timeframe : Daily
Previous candle closed over Bollinger bands
Type : Neutral
Timeframe : Daily
CCI indicator: bearish divergence
Type : Bearish
Timeframe : Daily
RSI indicator: bearish divergence
Type : Bearish
Timeframe : Daily
Williams %R indicator is overbought : over -20
Type : Neutral
Timeframe : Daily
Pivot points : price is over resistance 3
Type : Neutral
Timeframe : Daily
Pivot points : price is over resistance 3
Type : Neutral
Timeframe : Weekly
Pivot points : price is under support 3
Type : Neutral
Timeframe : Daily
No signals are given by Central Patterns, a market scanner specialised in chart patterns, resistances and supports.
For a small setback in the very short term, the Central Candlesticks scanner currently notes the presence of this bearish pattern in Japanese candlesticks:
Bearish harami
Type : Bearish
Timeframe : Daily
| S3 | S2 | S1 | Price | R1 | |
|---|---|---|---|---|---|
| ProTrendLines | 0.039100 | 0.054997 | 0.093600 | 0.128200 | 2.290000 |
| Change (%) | -69.50% | -57.10% | -26.99% | - | +1,686.27% |
| Change | -0.089100 | -0.073203 | -0.034600 | - | +2.161800 |
| Level | Minor | Minor | Major | - | Intermediate |
To determine price objectives, it is also possible to use the pivot points. Here is the price position in relation to pivot points:
| Pivot points | S3 | S2 | S1 | PP | R1 | R2 | R3 |
|---|---|---|---|---|---|---|---|
| Standard | 0.117167 | 0.123833 | 0.131667 | 0.138333 | 0.146167 | 0.152833 | 0.160667 |
| Camarilla | 0.135513 | 0.136842 | 0.138171 | 0.139500 | 0.140829 | 0.142158 | 0.143488 |
| Woodie | 0.117750 | 0.124125 | 0.132250 | 0.138625 | 0.146750 | 0.153125 | 0.161250 |
| Fibonacci | 0.123833 | 0.129372 | 0.132794 | 0.138333 | 0.143872 | 0.147294 | 0.152833 |
| Pivot points | S3 | S2 | S1 | PP | R1 | R2 | R3 |
|---|---|---|---|---|---|---|---|
| Standard | 0.043650 | 0.065420 | 0.103860 | 0.125630 | 0.164070 | 0.185840 | 0.224280 |
| Camarilla | 0.125742 | 0.131262 | 0.136781 | 0.142300 | 0.147819 | 0.153339 | 0.158858 |
| Woodie | 0.051985 | 0.069588 | 0.112195 | 0.129798 | 0.172405 | 0.190008 | 0.232615 |
| Fibonacci | 0.065420 | 0.088420 | 0.102630 | 0.125630 | 0.148630 | 0.162840 | 0.185840 |
| Pivot points | S3 | S2 | S1 | PP | R1 | R2 | R3 |
|---|---|---|---|---|---|---|---|
| Standard | -0.007640 | 0.015930 | 0.051860 | 0.075430 | 0.111360 | 0.134930 | 0.170860 |
| Camarilla | 0.071428 | 0.076882 | 0.082336 | 0.087790 | 0.093244 | 0.098698 | 0.104153 |
| Woodie | -0.001460 | 0.019020 | 0.058040 | 0.078520 | 0.117540 | 0.138020 | 0.177040 |
| Fibonacci | 0.015930 | 0.038659 | 0.052701 | 0.075430 | 0.098159 | 0.112201 | 0.134930 |
Numerical data
The following are the details of the technical indicators and moving averages that were collected to generate this technical analysis:
| RSI (14): | 69.90 | |
| MACD (12,26,9): | 0.0156 | |
| Directional Movement: | 31.402787 | |
| AROON (14): | 71.428573 | |
| DEMA (21): | 0.125915 | |
| Parabolic SAR (0,02-0,02-0,2): | 0.108881 | |
| Elder Ray (13): | 0.020457 | |
| Super Trend (3,10): | 0.098771 | |
| Zig ZAG (10): | 0.131500 | |
| VORTEX (21): | 1.1958 | |
| Stochastique (14,3,5): | 84.85 | |
| TEMA (21): | 0.131940 | |
| Williams %R (14): | -25.66 | |
| Chande Momentum Oscillator (20): | 0.042710 | |
| Repulse (5,40,3): | 1.6993 | |
| ROCnROLL: | 1 | |
| TRIX (15,9): | 2.1061 | |
| Courbe Coppock: | 81.28 |
| MA7: | 0.124643 | |
| MA20: | 0.102124 | |
| MA50: | 0.077825 | |
| MA100: | 0.055817 | |
| MAexp7: | 0.124853 | |
| MAexp20: | 0.106663 | |
| MAexp50: | 0.084302 | |
| MAexp100: | 0.064250 | |
| Price / MA7: | +2.85% | |
| Price / MA20: | +25.53% | |
| Price / MA50: | +64.73% | |
| Price / MA100: | +129.68% | |
| Price / MAexp7: | +2.68% | |
| Price / MAexp20: | +20.19% | |
| Price / MAexp50: | +52.07% | |
| Price / MAexp100: | +99.53% |
About author

Online


Add a comment
Comments
0 comments on the analysis VECHAIN - VET/USD - Daily