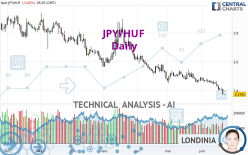
JPY/HUF - Daily - Technical analysis published on 06/22/2023 (GMT)
- 87
- 0
Click here for a new analysis!
- Timeframe : Daily
- - Analysis generated on
- Status : INVALID

Summary of the analysis

Additional analysis
Quotes
The JPY/HUF price is 2.3741 HUF. The price has increased by +0.00% since the last closing and was traded between 2.3713 HUF and 2.3766 HUF over the period. The price is currently at +0.12% from its lowest and -0.11% from its highest.The Central Gaps scanner detects a bearish opening marking the presence of sellers ahead of buyers at the opening but not sufficiently marked to allow the price to register a quotation gap.
Bearish opening
Type : Bearish
Timeframe : Openning
So that you have an overall view of the price change, here is a table showing the variations over several periods:
New LOW record (5 years)
Type : Bearish
Timeframe : Weekly
Near a new LOW record (1 year)
Type : Bearish
Timeframe : Weekly
Near a new LOW record (1st january)
Type : Bearish
Timeframe : Weekly
Near a new LOW record (1 month)
Type : Bearish
Timeframe : Weekly
Technical
Technical analysis of this Daily chart of JPY/HUF indicates that the overall trend is strongly bearish. The signals given by moving averages are 92.86% bearish. This strong bearish trend is confirmed by the strong signals currently being given by short-term moving averages. The Central Indicators market scanner currently does not detect any result that concerns moving averages.
In fact, 14 technical indicators on 18 studied are currently bearish. Caution: the Central Indicators scanner currently detects an excess:
RSI indicator is oversold : under 30
Type : Neutral
Timeframe : Daily
CCI indicator is oversold : under -100
Type : Neutral
Timeframe : Daily
Previous candle closed under Bollinger bands
Type : Neutral
Timeframe : Daily
CCI indicator: bullish divergence
Type : Bullish
Timeframe : Daily
Williams %R indicator is oversold : under -80
Type : Neutral
Timeframe : Daily
Pivot points : price is under support 1
Type : Neutral
Timeframe : Weekly
The Central Patterns scanner, which studies chart patterns, resistances and supports, has identified this signal:
Near support of channel
Type : Bullish
Timeframe : Daily
There is also a Japanese candlestick pattern detected by Central Candlesticks that could mark the end of the current short-term trend:
Doji
Type : Neutral
Timeframe : Daily
| S3 | S2 | S1 | Price | R1 | R2 | R3 | |
|---|---|---|---|---|---|---|---|
| ProTrendLines | 1.7091 | 2.0477 | 2.2575 | 2.3741 | 2.4985 | 2.5875 | 2.6604 |
| Change (%) | -28.01% | -13.75% | -4.91% | - | +5.24% | +8.99% | +12.06% |
| Change | -0.6650 | -0.3264 | -0.1166 | - | +0.1244 | +0.2134 | +0.2863 |
| Level | Minor | Major | Intermediate | - | Minor | Intermediate | Intermediate |
To determine price objectives, it is also possible to use the pivot points. Here is the price position in relation to pivot points:
| Pivot points | S3 | S2 | S1 | PP | R1 | R2 | R3 |
|---|---|---|---|---|---|---|---|
| Standard | 2.3156 | 2.3421 | 2.3581 | 2.3846 | 2.4006 | 2.4271 | 2.4431 |
| Camarilla | 2.3625 | 2.3664 | 2.3703 | 2.3742 | 2.3781 | 2.3820 | 2.3859 |
| Woodie | 2.3105 | 2.3395 | 2.3530 | 2.3820 | 2.3955 | 2.4245 | 2.4380 |
| Fibonacci | 2.3421 | 2.3583 | 2.3683 | 2.3846 | 2.4008 | 2.4108 | 2.4271 |
| Pivot points | S3 | S2 | S1 | PP | R1 | R2 | R3 |
|---|---|---|---|---|---|---|---|
| Standard | 2.3213 | 2.3636 | 2.3857 | 2.4280 | 2.4501 | 2.4924 | 2.5145 |
| Camarilla | 2.3900 | 2.3959 | 2.4018 | 2.4077 | 2.4136 | 2.4195 | 2.4254 |
| Woodie | 2.3111 | 2.3586 | 2.3755 | 2.4230 | 2.4399 | 2.4874 | 2.5043 |
| Fibonacci | 2.3636 | 2.3882 | 2.4034 | 2.4280 | 2.4526 | 2.4678 | 2.4924 |
| Pivot points | S3 | S2 | S1 | PP | R1 | R2 | R3 |
|---|---|---|---|---|---|---|---|
| Standard | 2.3497 | 2.3993 | 2.4453 | 2.4949 | 2.5409 | 2.5905 | 2.6365 |
| Camarilla | 2.4649 | 2.4737 | 2.4824 | 2.4912 | 2.5000 | 2.5087 | 2.5175 |
| Woodie | 2.3478 | 2.3984 | 2.4434 | 2.4940 | 2.5390 | 2.5896 | 2.6346 |
| Fibonacci | 2.3993 | 2.4359 | 2.4584 | 2.4949 | 2.5315 | 2.5540 | 2.5905 |
Numerical data
The following are the details of the technical indicators and moving averages that were collected to generate this technical analysis:
| RSI (14): | 24.66 | |
| MACD (12,26,9): | -0.0308 | |
| Directional Movement: | -21.6166 | |
| AROON (14): | -92.8571 | |
| DEMA (21): | 2.4018 | |
| Parabolic SAR (0,02-0,02-0,2): | 2.4392 | |
| Elder Ray (13): | -0.0500 | |
| Super Trend (3,10): | 2.4436 | |
| Zig ZAG (10): | 2.3736 | |
| VORTEX (21): | 0.7572 | |
| Stochastique (14,3,5): | 5.27 | |
| TEMA (21): | 2.3936 | |
| Williams %R (14): | -95.45 | |
| Chande Momentum Oscillator (20): | -0.0958 | |
| Repulse (5,40,3): | -1.9937 | |
| ROCnROLL: | 2 | |
| TRIX (15,9): | -0.1342 | |
| Courbe Coppock: | 5.53 |
| MA7: | 2.4079 | |
| MA20: | 2.4469 | |
| MA50: | 2.4888 | |
| MA100: | 2.5808 | |
| MAexp7: | 2.4038 | |
| MAexp20: | 2.4402 | |
| MAexp50: | 2.4945 | |
| MAexp100: | 2.5698 | |
| Price / MA7: | -1.40% | |
| Price / MA20: | -2.98% | |
| Price / MA50: | -4.61% | |
| Price / MA100: | -8.01% | |
| Price / MAexp7: | -1.24% | |
| Price / MAexp20: | -2.71% | |
| Price / MAexp50: | -4.83% | |
| Price / MAexp100: | -7.62% |
About author
Online


Add a comment
Comments
0 comments on the analysis JPY/HUF - Daily