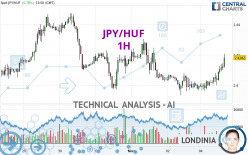
JPY/HUF - 1H - Technical analysis published on 02/05/2024 (GMT)
- 80
- 0
Click here for a new analysis!
- Timeframe : 1H
- - Analysis generated on
- Status : LEVEL MAINTAINED

Summary of the analysis

Additional analysis
Quotes
The JPY/HUF price is 2.4182 HUF. On the day, this instrument gained +0.78% and was traded between 2.3963 HUF and 2.4207 HUF over the period. The price is currently at +0.91% from its lowest and -0.10% from its highest.The Central Gaps scanner detects a bearish opening. A small advantage for sellers in the very short term.
Bearish opening
Type : Bearish
Timeframe : Openning
Here is a more detailed summary of the historical variations registered by JPY/HUF:
Near a new LOW record (5 years)
Type : Bearish
Timeframe : Weekly
Near a new LOW record (1 year)
Type : Bearish
Timeframe : Weekly
Near a new HIGH record (1st january)
Type : Bullish
Timeframe : Weekly
Near a new LOW record (1 month)
Type : Bearish
Timeframe : Weekly
Technical
Technical analysis of JPY/HUF in 1H shows an overall slightly bullish trend. 60.71% of the signals given by moving averages are bullish. The overall trend could accelerate as strong bullish signals from short-term moving averages are expected. The Central Indicators market scanner currently does not detect any result that concerns moving averages.
Technical indicators are strongly bullish, suggesting that the price increase should continue.
Caution: the Central Indicators scanner currently detects an excess:
RSI indicator is overbought : over 70
Type : Neutral
Timeframe : 1 hour
CCI indicator is overbought : over 100
Type : Neutral
Timeframe : 1 hour
Williams %R indicator is overbought : over -20
Type : Neutral
Timeframe : 1 hour
Pivot points : price is over resistance 2
Type : Neutral
Timeframe : 1 hour
Price is back over the pivot point
Type : Bullish
Timeframe : Weekly
An analysis of the price chart with the Central Patterns scanner (detector of chart patterns and resistances and supports) shows several results that can have an impact on the price change:
Near horizontal resistance
Type : Bearish
Timeframe : 1 hour
Resistance of channel is broken
Type : Bullish
Timeframe : 1 hour
The presence of a bullish Japanese candlestick pattern detected by Central Candlesticks that could cause a very short term rebound was also detected:
Three white soldiers
Type : Bullish
Timeframe : 1 hour
| S3 | S2 | S1 | Price | R1 | R2 | R3 | |
|---|---|---|---|---|---|---|---|
| ProTrendLines | 2.4019 | 2.4077 | 2.4165 | 2.4182 | 2.4270 | 2.4475 | 2.4698 |
| Change (%) | -0.67% | -0.43% | -0.07% | - | +0.36% | +1.21% | +2.13% |
| Change | -0.0163 | -0.0105 | -0.0017 | - | +0.0088 | +0.0293 | +0.0516 |
| Level | Minor | Minor | Major | - | Intermediate | Minor | Major |
Pivot points can also be used to set your price objectives. Here is the price situation in relation to pivot points:
| Pivot points | S3 | S2 | S1 | PP | R1 | R2 | R3 |
|---|---|---|---|---|---|---|---|
| Standard | 2.3784 | 2.3859 | 2.3927 | 2.4002 | 2.4070 | 2.4145 | 2.4213 |
| Camarilla | 2.3956 | 2.3969 | 2.3982 | 2.3995 | 2.4008 | 2.4021 | 2.4034 |
| Woodie | 2.3781 | 2.3857 | 2.3924 | 2.4000 | 2.4067 | 2.4143 | 2.4210 |
| Fibonacci | 2.3859 | 2.3914 | 2.3947 | 2.4002 | 2.4057 | 2.4090 | 2.4145 |
| Pivot points | S3 | S2 | S1 | PP | R1 | R2 | R3 |
|---|---|---|---|---|---|---|---|
| Standard | 2.3253 | 2.3594 | 2.3794 | 2.4135 | 2.4335 | 2.4676 | 2.4876 |
| Camarilla | 2.3846 | 2.3896 | 2.3945 | 2.3995 | 2.4045 | 2.4094 | 2.4144 |
| Woodie | 2.3184 | 2.3559 | 2.3725 | 2.4100 | 2.4266 | 2.4641 | 2.4807 |
| Fibonacci | 2.3594 | 2.3800 | 2.3928 | 2.4135 | 2.4341 | 2.4469 | 2.4676 |
| Pivot points | S3 | S2 | S1 | PP | R1 | R2 | R3 |
|---|---|---|---|---|---|---|---|
| Standard | 2.2480 | 2.3015 | 2.3587 | 2.4122 | 2.4694 | 2.5229 | 2.5801 |
| Camarilla | 2.3856 | 2.3957 | 2.4059 | 2.4160 | 2.4262 | 2.4363 | 2.4464 |
| Woodie | 2.2500 | 2.3024 | 2.3607 | 2.4131 | 2.4714 | 2.5238 | 2.5821 |
| Fibonacci | 2.3015 | 2.3438 | 2.3699 | 2.4122 | 2.4545 | 2.4806 | 2.5229 |
Numerical data
The following are the details of the technical indicators and moving averages that were collected to generate this technical analysis:
| RSI (14): | 71.79 | |
| MACD (12,26,9): | 0.0024 | |
| Directional Movement: | 14.0248 | |
| AROON (14): | 92.8571 | |
| DEMA (21): | 2.4083 | |
| Parabolic SAR (0,02-0,02-0,2): | 2.4024 | |
| Elder Ray (13): | 0.0069 | |
| Super Trend (3,10): | 2.4003 | |
| Zig ZAG (10): | 2.4162 | |
| VORTEX (21): | 1.1550 | |
| Stochastique (14,3,5): | 90.44 | |
| TEMA (21): | 2.4121 | |
| Williams %R (14): | -1.89 | |
| Chande Momentum Oscillator (20): | 0.0146 | |
| Repulse (5,40,3): | 0.4529 | |
| ROCnROLL: | 1 | |
| TRIX (15,9): | 0.0042 | |
| Courbe Coppock: | 0.88 |
| MA7: | 2.4146 | |
| MA20: | 2.3938 | |
| MA50: | 2.4054 | |
| MA100: | 2.4084 | |
| MAexp7: | 2.4112 | |
| MAexp20: | 2.4059 | |
| MAexp50: | 2.4062 | |
| MAexp100: | 2.4089 | |
| Price / MA7: | +0.15% | |
| Price / MA20: | +1.02% | |
| Price / MA50: | +0.53% | |
| Price / MA100: | +0.41% | |
| Price / MAexp7: | +0.29% | |
| Price / MAexp20: | +0.51% | |
| Price / MAexp50: | +0.50% | |
| Price / MAexp100: | +0.39% |
About author
Online


Add a comment
Comments
0 comments on the analysis JPY/HUF - 1H