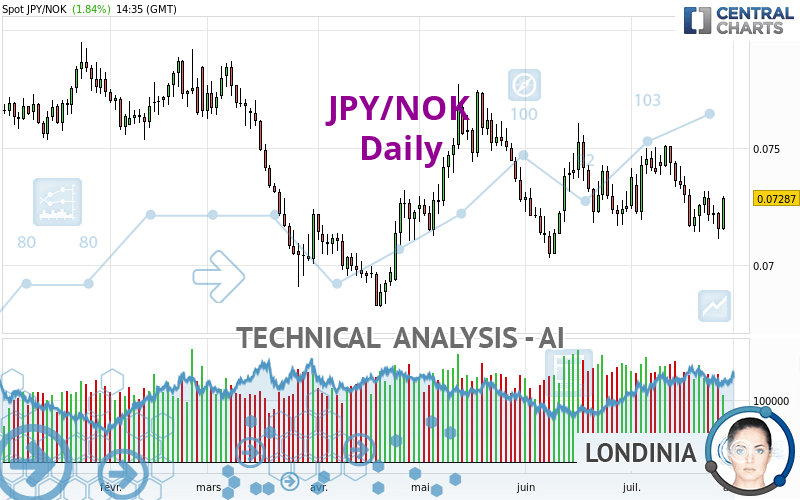
JPY/NOK - Daily - Technical analysis published on 07/28/2022 (GMT)
- 111
- 0
Click here for a new analysis!
- Timeframe : Daily
- - Analysis generated on
- Status : INVALID

Summary of the analysis

Additional analysis
Quotes
JPY/NOK rating 0.07287 NOK. The price registered an increase of +1.85% on the session and was traded between 0.07147 NOK and 0.07295 NOK over the period. The price is currently at +1.96% from its lowest and -0.11% from its highest.A study of price movements over other periods shows the following variations:
Near a new LOW record (5 years)
Type : Bearish
Timeframe : Weekly
Near a new LOW record (1 year)
Type : Bearish
Timeframe : Weekly
Near a new LOW record (1st january)
Type : Bearish
Timeframe : Weekly
Near a new HIGH record (1 month)
Type : Bullish
Timeframe : Weekly
Technical
Technical analysis of JPY/NOK in Daily shows an overall bearish trend. 67.86% of the signals given by moving averages are bearish. Caution: the neutral signals currently given by short-term moving averages show us that the global trend is losing momentum. An assessment of moving averages reveals several bullish signals that could impact this trend:
Bullish price crossover with Moving Average 100
Type : Bullish
Timeframe : Daily
Bullish price crossover with adaptative moving average 50
Type : Bullish
Timeframe : Daily
The technical indicators are generally neutral. They do not provide relevant information on the direction of future price movements.
Caution: the Central Indicators scanner currently detects an excess:
CCI indicator: bullish divergence
Type : Bullish
Timeframe : Daily
RSI indicator: bullish divergence
Type : Bullish
Timeframe : Daily
Pivot points : price is over resistance 2
Type : Neutral
Timeframe : Daily
Price is back under the pivot point
Type : Bearish
Timeframe : Weekly
The Central Patterns scanner, which studies chart patterns, resistances and supports, has identified these signals:
Near horizontal resistance
Type : Bearish
Timeframe : Daily
Near support of channel
Type : Bullish
Timeframe : Daily
Near support of triangle
Type : Bullish
Timeframe : Daily
The Central Candlesticks scanner, specialised in Japanese candlesticks, did not identify any signals.
| S3 | S2 | S1 | Price | R1 | R2 | R3 | |
|---|---|---|---|---|---|---|---|
| ProTrendLines | 0.06826 | 0.07046 | 0.07268 | 0.07287 | 0.07512 | 0.07731 | 0.07867 |
| Change (%) | -6.33% | -3.31% | -0.26% | - | +3.09% | +6.09% | +7.96% |
| Change | -0.00461 | -0.00241 | -0.00019 | - | +0.00225 | +0.00444 | +0.00580 |
| Level | Major | Minor | Major | - | Intermediate | Intermediate | Intermediate |
To determine price objectives, it is also possible to use the pivot points. Here is the price position in relation to pivot points:
| Pivot points | S3 | S2 | S1 | PP | R1 | R2 | R3 |
|---|---|---|---|---|---|---|---|
| Standard | 0.06990 | 0.07050 | 0.07103 | 0.07163 | 0.07216 | 0.07276 | 0.07329 |
| Camarilla | 0.07124 | 0.07134 | 0.07145 | 0.07155 | 0.07165 | 0.07176 | 0.07186 |
| Woodie | 0.06986 | 0.07048 | 0.07099 | 0.07161 | 0.07212 | 0.07274 | 0.07325 |
| Fibonacci | 0.07050 | 0.07094 | 0.07120 | 0.07163 | 0.07207 | 0.07233 | 0.07276 |
| Pivot points | S3 | S2 | S1 | PP | R1 | R2 | R3 |
|---|---|---|---|---|---|---|---|
| Standard | 0.06919 | 0.07030 | 0.07160 | 0.07271 | 0.07401 | 0.07512 | 0.07642 |
| Camarilla | 0.07225 | 0.07247 | 0.07269 | 0.07291 | 0.07313 | 0.07335 | 0.07357 |
| Woodie | 0.06930 | 0.07035 | 0.07171 | 0.07276 | 0.07412 | 0.07517 | 0.07653 |
| Fibonacci | 0.07030 | 0.07122 | 0.07179 | 0.07271 | 0.07363 | 0.07420 | 0.07512 |
| Pivot points | S3 | S2 | S1 | PP | R1 | R2 | R3 |
|---|---|---|---|---|---|---|---|
| Standard | 0.06410 | 0.06720 | 0.06985 | 0.07295 | 0.07560 | 0.07870 | 0.08135 |
| Camarilla | 0.07092 | 0.07145 | 0.07197 | 0.07250 | 0.07303 | 0.07355 | 0.07408 |
| Woodie | 0.06388 | 0.06709 | 0.06963 | 0.07284 | 0.07538 | 0.07859 | 0.08113 |
| Fibonacci | 0.06720 | 0.06940 | 0.07075 | 0.07295 | 0.07515 | 0.07650 | 0.07870 |
Numerical data
The following is the status of technical indicators and moving averages registered at the time this technical analysis was created:
| RSI (14): | 49.31 | |
| MACD (12,26,9): | -0.0003 | |
| Directional Movement: | -2.24865 | |
| AROON (14): | -78.57143 | |
| DEMA (21): | 0.07254 | |
| Parabolic SAR (0,02-0,02-0,2): | 0.07375 | |
| Elder Ray (13): | -0.00048 | |
| Super Trend (3,10): | 0.07080 | |
| Zig ZAG (10): | 0.07282 | |
| VORTEX (21): | 0.9915 | |
| Stochastique (14,3,5): | 26.09 | |
| TEMA (21): | 0.07227 | |
| Williams %R (14): | -54.89 | |
| Chande Momentum Oscillator (20): | -0.00217 | |
| Repulse (5,40,3): | 1.7567 | |
| ROCnROLL: | -1 | |
| TRIX (15,9): | -0.0312 | |
| Courbe Coppock: | 4.26 |
| MA7: | 0.07233 | |
| MA20: | 0.07322 | |
| MA50: | 0.07324 | |
| MA100: | 0.07278 | |
| MAexp7: | 0.07244 | |
| MAexp20: | 0.07286 | |
| MAexp50: | 0.07313 | |
| MAexp100: | 0.07358 | |
| Price / MA7: | +0.75% | |
| Price / MA20: | -0.48% | |
| Price / MA50: | -0.51% | |
| Price / MA100: | +0.12% | |
| Price / MAexp7: | +0.59% | |
| Price / MAexp20: | +0.01% | |
| Price / MAexp50: | -0.36% | |
| Price / MAexp100: | -0.96% |
About author
Online


Add a comment
Comments
0 comments on the analysis JPY/NOK - Daily