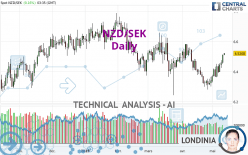
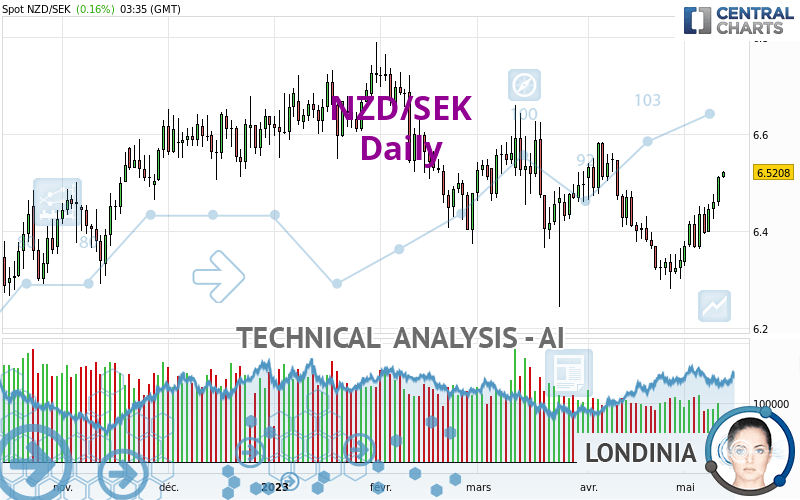
NZD/SEK - Daily - Technical analysis published on 05/11/2023 (GMT)
- 106
- 0
Click here for a new analysis!
- Timeframe : Daily
- - Analysis generated on
- Status : TARGET REACHED
Summary of the analysis

Additional analysis
Quotes
NZD/SEK rating 6.5208 SEK. On the day, this instrument gained +0.16% with the lowest point at 6.5100 SEK and the highest point at 6.5234 SEK. The deviation from the price is +0.17% for the low point and -0.04% for the high point.A bullish opening was detected by the Central Gaps scanner. Buyers are trying to impose a bullish momentum in the very short term.
Bullish opening
Type : Bullish
Timeframe : Openning
A study of price movements over other periods shows the following variations:
Near a new LOW record (1 year)
Type : Bearish
Timeframe : Weekly
Near a new HIGH record (1st january)
Type : Bullish
Timeframe : Weekly
New HIGH record (1 month)
Type : Bullish
Timeframe : Weekly
Technical
Technical analysis of NZD/SEK in Daily shows a neutral overall trend. The trend could quickly turn bullish due to the strong bullish signals currently being given by short-term moving averages. The Central Indicators scanner detects bullish signals on moving averages that could impact this trend:
Bullish trend reversal : Moving Average 20
Type : Bullish
Timeframe : Daily
Bullish trend reversal : adaptative moving average 100
Type : Bullish
Timeframe : Daily
The probability of a further increase is high given the direction of the technical indicators.
But beware of excesses. The Central Indicators scanner currently detects this:
CCI indicator is overbought : over 100
Type : Neutral
Timeframe : Daily
Previous candle closed over Bollinger bands
Type : Neutral
Timeframe : Daily
Williams %R indicator is overbought : over -20
Type : Neutral
Timeframe : Daily
Pivot points : price is over resistance 2
Type : Neutral
Timeframe : Weekly
Ichimoku : price is over the cloud
Type : Bullish
Timeframe : Daily
MACD indicator is back over 0
Type : Bullish
Timeframe : Daily
Central Patterns, the market scanner focusing on chart patterns, resistances and supports found these results:
Near horizontal resistance
Type : Bearish
Timeframe : Daily
Resistance of channel is broken
Type : Bullish
Timeframe : Daily
The presence of a bearish pattern in Japanese candlesticks detected by Central Candlesticks that could cause a correction in the very short term was also detected:
Bearish doji star
Type : Bearish
Timeframe : Daily
| S3 | S2 | S1 | Price | R1 | R2 | R3 | |
|---|---|---|---|---|---|---|---|
| ProTrendLines | 6.3151 | 6.4201 | 6.5089 | 6.5208 | 6.5824 | 6.6572 | 6.7259 |
| Change (%) | -3.15% | -1.54% | -0.18% | - | +0.94% | +2.09% | +3.15% |
| Change | -0.2057 | -0.1007 | -0.0119 | - | +0.0616 | +0.1364 | +0.2051 |
| Level | Minor | Major | Major | - | Major | Major | Intermediate |
Pivot points can also be used to set your price objectives. Here is the price situation in relation to pivot points:
| Pivot points | S3 | S2 | S1 | PP | R1 | R2 | R3 |
|---|---|---|---|---|---|---|---|
| Standard | 6.4067 | 6.4288 | 6.4694 | 6.4915 | 6.5321 | 6.5542 | 6.5948 |
| Camarilla | 6.4929 | 6.4986 | 6.5044 | 6.5101 | 6.5159 | 6.5216 | 6.5273 |
| Woodie | 6.4161 | 6.4334 | 6.4788 | 6.4961 | 6.5415 | 6.5588 | 6.6042 |
| Fibonacci | 6.4288 | 6.4527 | 6.4675 | 6.4915 | 6.5154 | 6.5302 | 6.5542 |
| Pivot points | S3 | S2 | S1 | PP | R1 | R2 | R3 |
|---|---|---|---|---|---|---|---|
| Standard | 6.2097 | 6.2690 | 6.3322 | 6.3915 | 6.4547 | 6.5140 | 6.5772 |
| Camarilla | 6.3616 | 6.3728 | 6.3841 | 6.3953 | 6.4065 | 6.4178 | 6.4290 |
| Woodie | 6.2116 | 6.2700 | 6.3341 | 6.3925 | 6.4566 | 6.5150 | 6.5791 |
| Fibonacci | 6.2690 | 6.3158 | 6.3447 | 6.3915 | 6.4383 | 6.4672 | 6.5140 |
| Pivot points | S3 | S2 | S1 | PP | R1 | R2 | R3 |
|---|---|---|---|---|---|---|---|
| Standard | 5.9175 | 6.0993 | 6.2198 | 6.4016 | 6.5221 | 6.7039 | 6.8244 |
| Camarilla | 6.2573 | 6.2850 | 6.3127 | 6.3404 | 6.3681 | 6.3958 | 6.4235 |
| Woodie | 5.8870 | 6.0840 | 6.1893 | 6.3863 | 6.4916 | 6.6886 | 6.7939 |
| Fibonacci | 6.0993 | 6.2148 | 6.2861 | 6.4016 | 6.5171 | 6.5884 | 6.7039 |
Numerical data
The following is the status of the technical indicators and moving averages at the time of publication of this technical analysis:
| RSI (14): | 60.48 | |
| MACD (12,26,9): | 0.0059 | |
| Directional Movement: | 6.4377 | |
| AROON (14): | 78.5714 | |
| DEMA (21): | 6.4234 | |
| Parabolic SAR (0,02-0,02-0,2): | 6.3396 | |
| Elder Ray (13): | 0.0822 | |
| Super Trend (3,10): | 6.3504 | |
| Zig ZAG (10): | 6.5190 | |
| VORTEX (21): | 1.0903 | |
| Stochastique (14,3,5): | 96.42 | |
| TEMA (21): | 6.4535 | |
| Williams %R (14): | -0.58 | |
| Chande Momentum Oscillator (20): | 0.1832 | |
| Repulse (5,40,3): | 1.2534 | |
| ROCnROLL: | 1 | |
| TRIX (15,9): | -0.0433 | |
| Courbe Coppock: | 2.60 |
| MA7: | 6.4477 | |
| MA20: | 6.3924 | |
| MA50: | 6.4592 | |
| MA100: | 6.5336 | |
| MAexp7: | 6.4596 | |
| MAexp20: | 6.4273 | |
| MAexp50: | 6.4548 | |
| MAexp100: | 6.4848 | |
| Price / MA7: | +1.13% | |
| Price / MA20: | +2.01% | |
| Price / MA50: | +0.95% | |
| Price / MA100: | -0.20% | |
| Price / MAexp7: | +0.95% | |
| Price / MAexp20: | +1.45% | |
| Price / MAexp50: | +1.02% | |
| Price / MAexp100: | +0.56% |
About author
Online


Add a comment
Comments
0 comments on the analysis NZD/SEK - Daily