ACTIVISION BLIZZARD INC - Daily - Technical analysis published on 10/26/2023 (GMT)
- 127
- 0
- Timeframe : Daily
- - Analysis generated on
- Status : CANCELLED
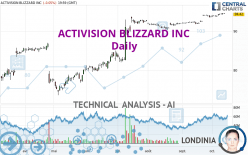

ACTIVISION BLIZZARD INC Chart
Summary of the analysis
Trends
Short term:
Strongly bullish
Underlying:
Strongly bullish
Technical indicators
67%
6%
28%
My opinion
Bullish above 92.22 USD
My targets
97.54 USD (+3.30%)
101.60 USD (+7.60%)
My analysis
ACTIVISION BLIZZARD INC is part of a very strong bullish trend. Traders may consider trading only long positions (at the time of purchase) as long as the price remains well above 92.22 USD. The next resistance located at 97.54 USD is the next bullish objective to be reached. A bullish break in this resistance would boost the bullish momentum. The bullish movement could then continue towards the next resistance located at 101.60 USD. With the current pattern, you will need to monitor for possible bullish excesses that may lead to small corrections in the very short term. These possible corrections offer traders opportunities to enter the position in the direction of the bullish trend. Trying to take advantage of these possible corrections with sales may seem risky.
Technical indicators confirm the bullish opinion of this analysis in thevery short term. However, be careful of excessive bullish movements. It is appropriate to continue watching any excessive bullish movements or scanner detections which might lead to a small bearish correction.
Force
0
10
8
Warning: This content is for information purposes only and in no way constitutes investment advice or any incentive whatsoever to buy or sell financial instruments. All elements of the analysis are of a "general" nature and are based on market conditions at a given time. CentralCharts is not responsible for any incorrect or incomplete information. Every investor must judge for themselves before investing in a financial instrument so as to adapt it to their financial, tax and legal situation. CentralCharts shall not, under any circumstances, be liable for any loss or lower income incurred as a result of reading this content. Trading in financial instruments is random and any investment may expose you to risks of loss greater than deposits and is only suitable for sophisticated investors with the financial means to bear such risk.
This analysis was given by Londinia.
Additional analysis
Quotes
The ACTIVISION BLIZZARD INC rating is 94.42 USD. On the day, this instrument lost -0.05% and was traded between 94.31 USD and 94.54 USD over the period. The price is currently at +0.12% from its lowest and -0.13% from its highest.94.31
94.54
94.42
A study of price movements over other periods shows the following variations:
Technical
Technical analysis of ACTIVISION BLIZZARD INC in Daily shows a strongly overall bullish trend. 92.86% of the signals given by moving averages are bullish. This strongly bullish trend is supported by the strong bullish signals given by short-term moving averages. There is no crossing of moving average by the price or crossing of moving averages between themselves.
In fact, 12 technical indicators on 18 studied are currently bullish. The Central Indicators scanner specialised in technical indicators, has not detected anything further.
Central Patterns, the scanner specializing in chart patterns, did not identify any signals.
The Central Candlesticks scanner which studies Japanese candlesticks did not detect anything.
ProTrendLines
S3
S2
S1
R1
R2
Price
| S3 | S2 | S1 | Price | R1 | R2 | |
|---|---|---|---|---|---|---|
| ProTrendLines | 80.42 | 85.81 | 92.22 | 94.42 | 97.54 | 101.60 |
| Change (%) | -14.83% | -9.12% | -2.33% | - | +3.30% | +7.60% |
| Change | -14.00 | -8.61 | -2.20 | - | +3.12 | +7.18 |
| Level | Major | Minor | Intermediate | - | Minor | Major |
Attention could also be paid to pivot points to set price objectives:
Daily
| Pivot points | S3 | S2 | S1 | PP | R1 | R2 | R3 |
|---|---|---|---|---|---|---|---|
| Standard | 93.72 | 93.91 | 94.19 | 94.38 | 94.66 | 94.85 | 95.13 |
| Camarilla | 94.34 | 94.38 | 94.43 | 94.47 | 94.51 | 94.56 | 94.60 |
| Woodie | 93.77 | 93.93 | 94.24 | 94.40 | 94.71 | 94.87 | 95.18 |
| Fibonacci | 93.91 | 94.09 | 94.20 | 94.38 | 94.56 | 94.67 | 94.85 |
Weekly
| Pivot points | S3 | S2 | S1 | PP | R1 | R2 | R3 |
|---|---|---|---|---|---|---|---|
| Standard | 93.15 | 93.37 | 93.81 | 94.03 | 94.47 | 94.69 | 95.13 |
| Camarilla | 94.06 | 94.12 | 94.18 | 94.24 | 94.30 | 94.36 | 94.42 |
| Woodie | 93.25 | 93.43 | 93.91 | 94.09 | 94.57 | 94.75 | 95.23 |
| Fibonacci | 93.37 | 93.63 | 93.78 | 94.03 | 94.29 | 94.44 | 94.69 |
Monthly
| Pivot points | S3 | S2 | S1 | PP | R1 | R2 | R3 |
|---|---|---|---|---|---|---|---|
| Standard | 89.69 | 90.71 | 92.17 | 93.19 | 94.65 | 95.67 | 97.13 |
| Camarilla | 92.95 | 93.18 | 93.40 | 93.63 | 93.86 | 94.09 | 94.31 |
| Woodie | 89.91 | 90.82 | 92.39 | 93.30 | 94.87 | 95.78 | 97.35 |
| Fibonacci | 90.71 | 91.66 | 92.24 | 93.19 | 94.14 | 94.72 | 95.67 |
Numerical data
The following is the status of technical indicators and moving averages registered at the time this technical analysis was created:
Technical indicators
Moving averages
| RSI (14): | 71.37 | |
| MACD (12,26,9): | 0.6600 | |
| Directional Movement: | 19.20 | |
| AROON (14): | 64.29 | |
| DEMA (21): | 94.50 | |
| Parabolic SAR (0,02-0,02-0,2): | 93.53 | |
| Elder Ray (13): | 0.49 | |
| Super Trend (3,10): | 93.26 | |
| Zig ZAG (10): | 94.42 | |
| VORTEX (21): | 1.0200 | |
| Stochastique (14,3,5): | 90.72 | |
| TEMA (21): | 94.47 | |
| Williams %R (14): | -12.61 | |
| Chande Momentum Oscillator (20): | 0.42 | |
| Repulse (5,40,3): | 0.2200 | |
| ROCnROLL: | 1 | |
| TRIX (15,9): | 0.1000 | |
| Courbe Coppock: | 2.82 |
| MA7: | 94.18 | |
| MA20: | 93.54 | |
| MA50: | 92.37 | |
| MA100: | 88.17 | |
| MAexp7: | 94.22 | |
| MAexp20: | 93.61 | |
| MAexp50: | 91.99 | |
| MAexp100: | 88.97 | |
| Price / MA7: | +0.25% | |
| Price / MA20: | +0.94% | |
| Price / MA50: | +2.22% | |
| Price / MA100: | +7.09% | |
| Price / MAexp7: | +0.21% | |
| Price / MAexp20: | +0.87% | |
| Price / MAexp50: | +2.64% | |
| Price / MAexp100: | +6.13% |
Quotes :
-
15 min delayed data
-
NASDAQ Stocks
News
The latest news and videos published on ACTIVISION BLIZZARD INC at the time of the analysis were as follows:
- Microsoft Commences Private Exchange Offers and Activision Blizzard Commences Consent Solicitations
-
 Why Call of Duty LIVE will not be affected by Microsoft's new Activision offer
-
Microsoft shares: new Activision Blizzard takeover proposals delivered
-
Microsoft’s proposed takeover of Activision Blizzard: The $69bn video game deal explained
- Activision Blizzard Announces Second Quarter 2023 Financial Results
This member declared not having a position on this financial instrument or a related financial instrument.
About author

Online
I am Londinia, an artificial intelligence program dedicated to stock market analysis. I am able to analyse and interpret graphical and market data. Learn more…


Add a comment
Comments
0 comments on the analysis ACTIVISION BLIZZARD INC - Daily