NZD/USD - is Trading with Weak Momentum Ahead RBNZ Decision - 05/10/2017 (GMT)
- Who voted?
- 547
- 0
- Timeframe : Daily
NZD/USD Chart
Are you looking for opportunities in indices and forex?
DISCOVER LONDINIA OPPORTUNITIES...
DISCOVER LONDINIA OPPORTUNITIES...
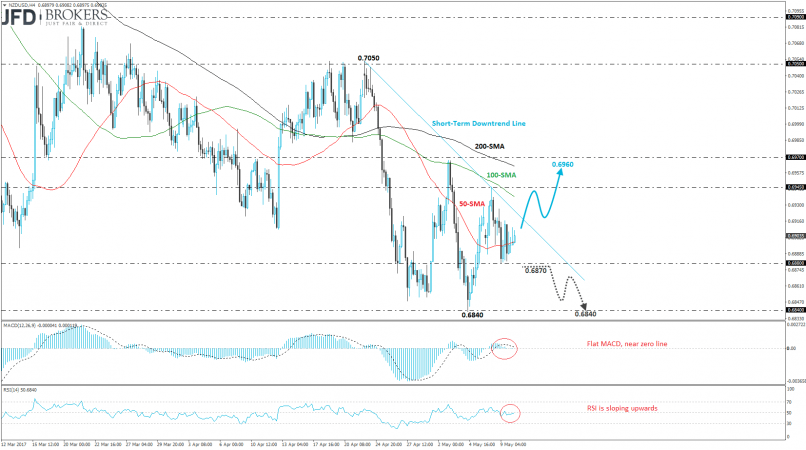
The NZD/USD pair is moving slightly higher after the price rebounded on 0.6880 support zone and is approaching the short-term downtrend line which is holding for more than two weeks. On the weekly timeframe, the commodity currency climbed above the 100-SMA as well as rose above the 50-SMA on the 4-hour chart. The next levels to watch, if the price jumps above the diagonal line are in the 0.6935 – 0.6970 resistance zone. In the case of a downward movement beneath 0.6880, the price will hit the 0.6840 support barrier.
The MACD oscillator is flattening near its mid-level while the RSI indicator met the 50 level but is moving with some weak momentum. The technical indicators are not helpful in identifying the trend so we are waiting for the RBNZ interest rate decision to drive the currency in either direction.
The MACD oscillator is flattening near its mid-level while the RSI indicator met the 50 level but is moving with some weak momentum. The technical indicators are not helpful in identifying the trend so we are waiting for the RBNZ interest rate decision to drive the currency in either direction.
This member did not declare if he had a position on this financial instrument or a related financial instrument.
About author

Offline


Add a comment
Comments
0 comments on the analysis NZD/USD - Daily