USD/CAD - Challenged the Short-Term Ascending Trend Line - Bullish Bias - 10/18/2017 (GMT)
- Who voted?
- 462
- 0
- Timeframe : 4H
USD/CAD Chart
Are you looking for opportunities in indices and forex?
DISCOVER LONDINIA OPPORTUNITIES...
DISCOVER LONDINIA OPPORTUNITIES...
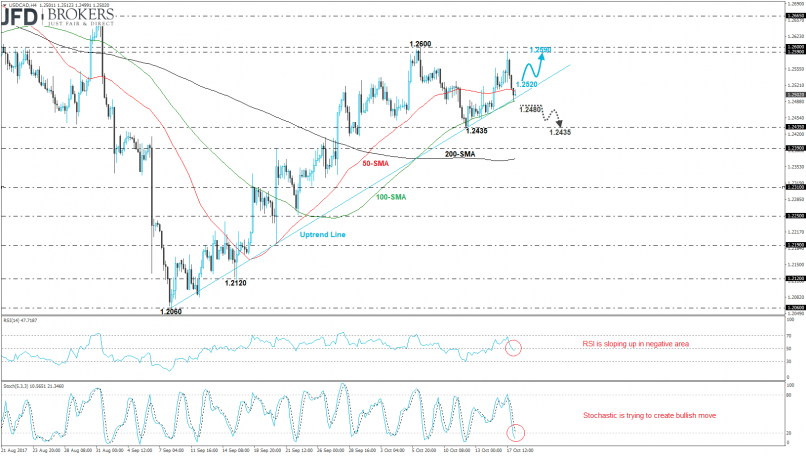
The USD/CAD par ended the day slightly lower from its opening level after the run to the upside slightly below the 1.2600 key level. The price recorded an intraday recovery and bounced off the 100-day SMA. Also, the commodity currency pair hit the ascending trend line on the 4-hour chart, as well as the 100-SMA and now is creating a slightly bullish movement.
In case of a jump above the 50-SMA, on the short-term chart, the price could run towards the 1.2590 – 1.2600 resistance area. An alternative thought is a drop below the uptrend line, which is holding since September 8th that will lose some ground until the 1.2435 support barrier. Remaining on the 4-hour chart, the RSI indicator is turning its negative tendency to an upside slope and is trying to insert into the positive zone. Also, the stochastic oscillator is trying to create a bullish move in the oversold area indicating for upside movement on price.
In case of a jump above the 50-SMA, on the short-term chart, the price could run towards the 1.2590 – 1.2600 resistance area. An alternative thought is a drop below the uptrend line, which is holding since September 8th that will lose some ground until the 1.2435 support barrier. Remaining on the 4-hour chart, the RSI indicator is turning its negative tendency to an upside slope and is trying to insert into the positive zone. Also, the stochastic oscillator is trying to create a bullish move in the oversold area indicating for upside movement on price.
This member declared not having a position on this financial instrument or a related financial instrument.
About author

Offline


Add a comment
Comments
0 comments on the analysis USD/CAD - 4H