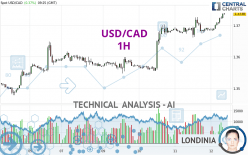
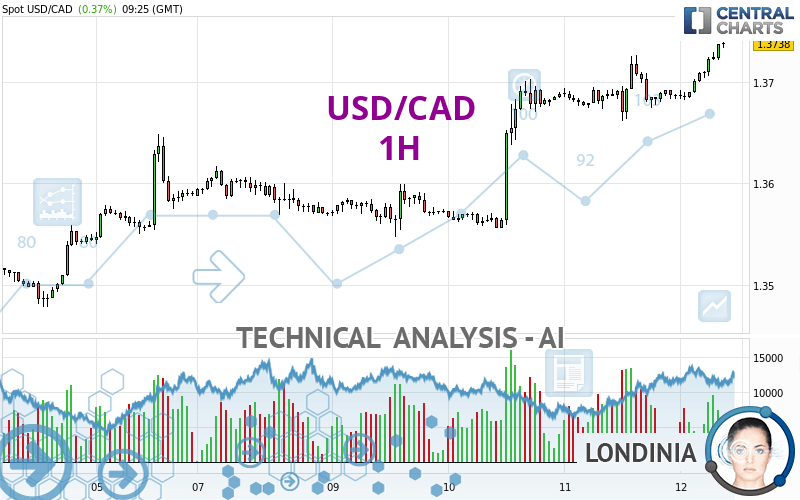
USD/CAD - 1H - Technical analysis published on 04/12/2024 (GMT)
- 61
- 0
Click here for a new analysis!
- Timeframe : 1H
- - Analysis generated on
- Status : LEVEL MAINTAINED
Summary of the analysis

Additional analysis
Quotes
The USD/CAD price is 1.3738 CAD. The price has increased by +0.37% since the last closing and was between 1.3682 CAD and 1.3739 CAD. This implies that the price is at +0.41% from its lowest and at -0.01% from its highest.A study of price movements over other periods shows the following variations:
Near a new LOW record (1 year)
Type : Bearish
Timeframe : Weekly
New HIGH record (1st january)
Type : Bullish
Timeframe : Weekly
New HIGH record (1 month)
Type : Bullish
Timeframe : Weekly
Technical
A technical analysis in 1H of this USD/CAD chart shows a strongly bullish trend. The signals given by the moving averages are 92.86% bullish. This strong bullish trend is confirmed by the strong signals currently being given by short-term moving averages. The Central Indicators market scanner currently does not detect any result that concerns moving averages.
The probability of a further increase is high given the direction of the technical indicators.
Caution: the Central Indicators scanner currently detects an excess:
RSI indicator is overbought : over 70
Type : Neutral
Timeframe : 1 hour
CCI indicator is overbought : over 100
Type : Neutral
Timeframe : 1 hour
Previous candle closed over Bollinger bands
Type : Neutral
Timeframe : 1 hour
CCI indicator: bearish divergence
Type : Bearish
Timeframe : 1 hour
Williams %R indicator is overbought : over -20
Type : Neutral
Timeframe : 1 hour
Pivot points : price is over resistance 1
Type : Neutral
Timeframe : 1 hour
Pivot points : price is over resistance 1
Type : Neutral
Timeframe : Weekly
Central Patterns, the scanner specializing in chart patterns, did not identify any signals.
No result was found by the Central Candlesticks scanner on Japanese candlesticks.
| S3 | S2 | S1 | Price | R1 | R2 | R3 | |
|---|---|---|---|---|---|---|---|
| ProTrendLines | 1.3661 | 1.3688 | 1.3726 | 1.3738 | 1.3809 | 1.3876 | 1.4567 |
| Change (%) | -0.56% | -0.36% | -0.09% | - | +0.52% | +1.00% | +6.03% |
| Change | -0.0077 | -0.0050 | -0.0012 | - | +0.0071 | +0.0138 | +0.0829 |
| Level | Minor | Major | Intermediate | - | Minor | Major | Minor |
To determine price objectives, it is also possible to use the pivot points. Here is the price position in relation to pivot points:
| Pivot points | S3 | S2 | S1 | PP | R1 | R2 | R3 |
|---|---|---|---|---|---|---|---|
| Standard | 1.3592 | 1.3626 | 1.3657 | 1.3691 | 1.3722 | 1.3756 | 1.3787 |
| Camarilla | 1.3669 | 1.3675 | 1.3681 | 1.3687 | 1.3693 | 1.3699 | 1.3705 |
| Woodie | 1.3590 | 1.3625 | 1.3655 | 1.3690 | 1.3720 | 1.3755 | 1.3785 |
| Fibonacci | 1.3626 | 1.3651 | 1.3667 | 1.3691 | 1.3716 | 1.3732 | 1.3756 |
| Pivot points | S3 | S2 | S1 | PP | R1 | R2 | R3 |
|---|---|---|---|---|---|---|---|
| Standard | 1.3325 | 1.3402 | 1.3495 | 1.3572 | 1.3665 | 1.3742 | 1.3835 |
| Camarilla | 1.3542 | 1.3558 | 1.3573 | 1.3589 | 1.3605 | 1.3620 | 1.3636 |
| Woodie | 1.3334 | 1.3406 | 1.3504 | 1.3576 | 1.3674 | 1.3746 | 1.3844 |
| Fibonacci | 1.3402 | 1.3467 | 1.3507 | 1.3572 | 1.3637 | 1.3677 | 1.3742 |
| Pivot points | S3 | S2 | S1 | PP | R1 | R2 | R3 |
|---|---|---|---|---|---|---|---|
| Standard | 1.3238 | 1.3329 | 1.3432 | 1.3523 | 1.3626 | 1.3717 | 1.3820 |
| Camarilla | 1.3482 | 1.3499 | 1.3517 | 1.3535 | 1.3553 | 1.3571 | 1.3588 |
| Woodie | 1.3244 | 1.3332 | 1.3438 | 1.3526 | 1.3632 | 1.3720 | 1.3826 |
| Fibonacci | 1.3329 | 1.3403 | 1.3449 | 1.3523 | 1.3597 | 1.3643 | 1.3717 |
Numerical data
The following are the details of the technical indicators and moving averages that were collected to generate this technical analysis:
| RSI (14): | 71.71 | |
| MACD (12,26,9): | 0.0014 | |
| Directional Movement: | 23.4001 | |
| AROON (14): | 100.0000 | |
| DEMA (21): | 1.3722 | |
| Parabolic SAR (0,02-0,02-0,2): | 1.3688 | |
| Elder Ray (13): | 0.0025 | |
| Super Trend (3,10): | 1.3702 | |
| Zig ZAG (10): | 1.3736 | |
| VORTEX (21): | 1.2677 | |
| Stochastique (14,3,5): | 95.82 | |
| TEMA (21): | 1.3723 | |
| Williams %R (14): | -3.45 | |
| Chande Momentum Oscillator (20): | 0.0045 | |
| Repulse (5,40,3): | 0.1612 | |
| ROCnROLL: | 1 | |
| TRIX (15,9): | 0.0105 | |
| Courbe Coppock: | 0.41 |
| MA7: | 1.3627 | |
| MA20: | 1.3579 | |
| MA50: | 1.3538 | |
| MA100: | 1.3491 | |
| MAexp7: | 1.3722 | |
| MAexp20: | 1.3704 | |
| MAexp50: | 1.3677 | |
| MAexp100: | 1.3644 | |
| Price / MA7: | +0.81% | |
| Price / MA20: | +1.17% | |
| Price / MA50: | +1.48% | |
| Price / MA100: | +1.83% | |
| Price / MAexp7: | +0.12% | |
| Price / MAexp20: | +0.25% | |
| Price / MAexp50: | +0.45% | |
| Price / MAexp100: | +0.69% |
News
The last news published on USD/CAD at the time of the generation of this analysis was as follows:
-
 USD/CAD Forecast April 10, 2024
-
Technical Analysis: 05/03/2024 - USDCAD ticks higher within ascending channel
-
Technical Analysis: 29/03/2024 - USDCAD pauses four-day slide
-
Technical Analysis: 22/03/2024 - Is there stronger bullish trend for USDCAD?
-
USD/CAD Forecast March 20, 2024
About author

Online


Add a comment
Comments
0 comments on the analysis USD/CAD - 1H